I've run a binary logistic regression using brms. I have one independent variable (Age) and 3 dependent variables, Y1, Y2, and Y3. These dependent variables are all pass/fail tasks. For each task, I want to model the probability of passing as a function of age. But, I also want to test the hypothesis that those who pass task 2 (Y2 = 1) tend to also pass task 3 (Y3 = 1).
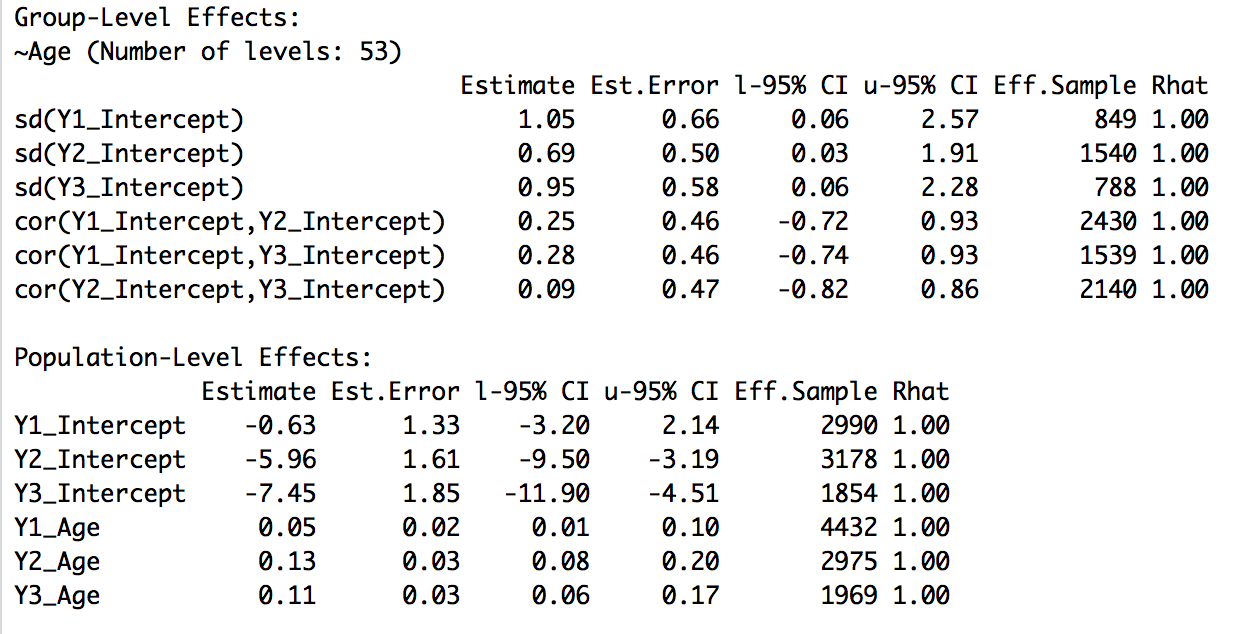
Here is the call & summary:
fit1 <- brm(mvbind(Y1,Y2,Y3) ~ Age + (1|p|Age), data = MyData, family = bernoulli)
add_ic(fit1) <- "loo"
summary(fit1)
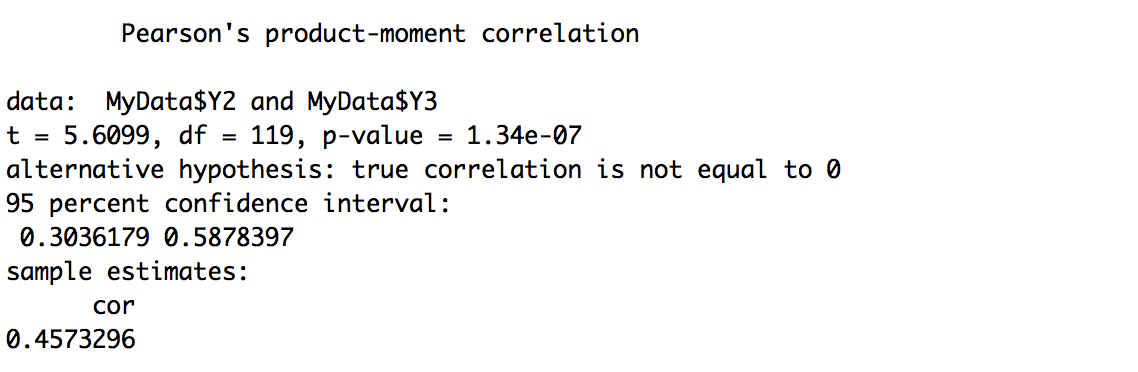
I'm new to brms, so there are two things I'm a little unsure about. First, how do I interpret the correlation estimates? I understand how to interpret the coefficients under "Population-Level Effects", but how do I interpret those under "Group-Level Effects"? For instance, how do I interpret the estimate of 0.09 for "cor(Y2_Intercept,Y3_Intercept)"? Second, the confidence intervals are very large for each correlation. Is the model suggesting that, in each case, there is no credible correlation? If so, this confuses me, because when I run cor.test, I get the following, which suggests a (statistically significant) moderate correlation:
I think the correlation estimates that you are looking at reflect whether a multivariate model is helping you at all (and the credible intervals would indicate that they do not). It also takes into account the covariates (and the confidence interval that you show does not)
Is Age a continuous number (as opposed to a factor or qualitative variable)? It's really hard to give good advice without any context or information about the data.
I would probably approach this using individual logistic regression models for each dependent variable (and write down the model that you want before fitting it).
Alternatively, you could stack the data and have a single dependent variable with a covariate for task. That might make a lot more sense and you can get posterior estimates of functions of those parameters.
Age is a continuous number, yes. I have about 120 subjects, ranging from 24 to 110 months of age.
I had considered going with separate regressions for each DV, while running a separate correlation test, but I was worried about alpha inflation. But maybe it's the way to go ...
Stacking the data also seems like a good option. Will look into it.