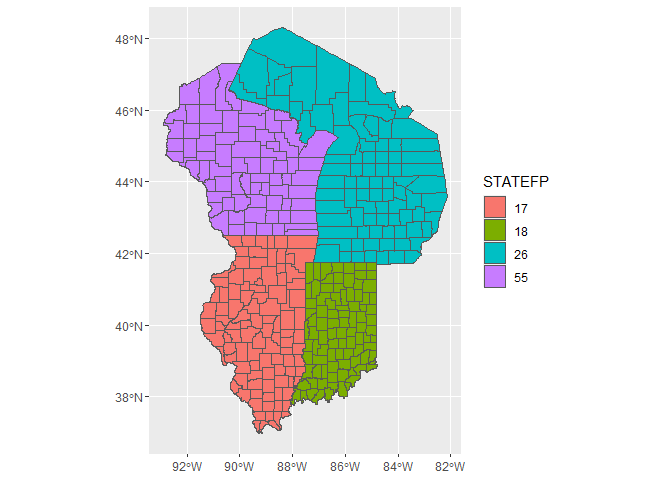
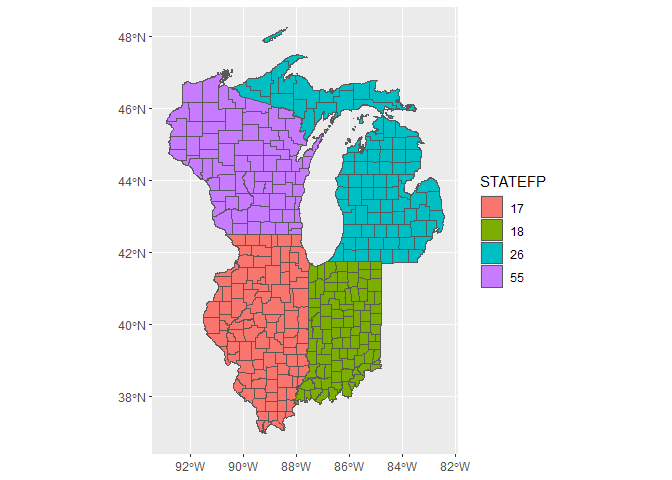
I'm trying to plot county-level data within the US. This is the first time I've worked with geospatial data. I've used tigris to import the county-level shape information but the problem I'm faced with now is that this information excludes bodies of water. I have found a solution to remove areas of water, but it feels suboptimal so I was wondering if there's an easier way to do this?
Here's a reprex:
library(tidyverse)
library(sf)
#> Linking to GEOS 3.6.1, GDAL 2.2.3, PROJ 4.9.3
options(tigris_use_cache = TRUE)
library(tigris)
#> To enable
#> caching of data, set `options(tigris_use_cache = TRUE)` in your R script or .Rprofile.
#>
#> Attaching package: 'tigris'
#> The following object is masked from 'package:graphics':
#>
#>     plot

# Get county maps for select states
state_map <- counties(state = c("Illinois", "Michigan", "Wisconsin", "Indiana")) %>% sf::st_as_sf()

# Note the distinct lack of Lake Michigan
state_map %>%
  ggplot(aes(fill = STATEFP)) +
  geom_sf()

# Get all counties for state 55 (WI)
wi_counties <- state_map %>% filter(STATEFP == 55) %>% distinct(COUNTYFP) %>% pull(COUNTYFP)

# Iterate over each county, get water shape info, select only large areas of water.
# Finally perform union for all filtered water shape info
wi_water <-
  map_dfr(
    wi_counties,
    ~ area_water("WI", county = ., class = "sf") %>% filter(AWATER > 10^8)
  ) %>%
  st_union()

# Remove overlapping regions between state_map and wi_water
state_minus_water <- st_difference(state_map, wi_water)
#> although coordinates are longitude/latitude, st_difference assumes that they are planar
#> Warning: attribute variables are assumed to be spatially constant throughout all
#> geometries

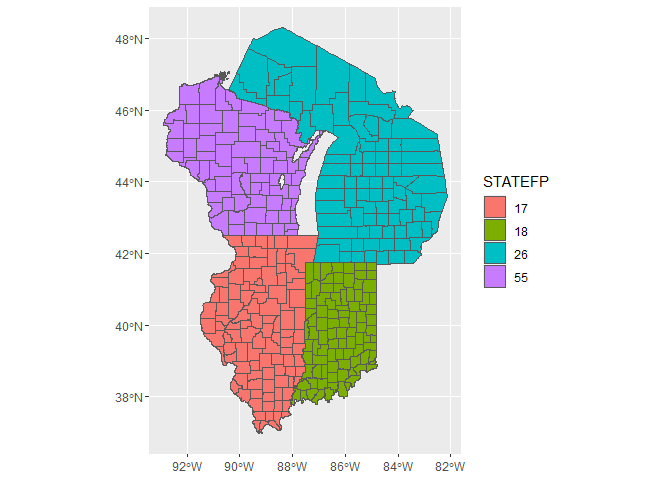
# Now we have a bit of Lake Michigan...
state_minus_water %>%
  ggplot(aes(fill = STATEFP)) +
    geom_sf()

So this works but the problem is I need to do this for all states. I can probably loop/map across all states/counties and perform a union, but this seems a bit inefficient... I'm also worried about running into memory issues, which has been a problem for me when I've been playing around with this data.
