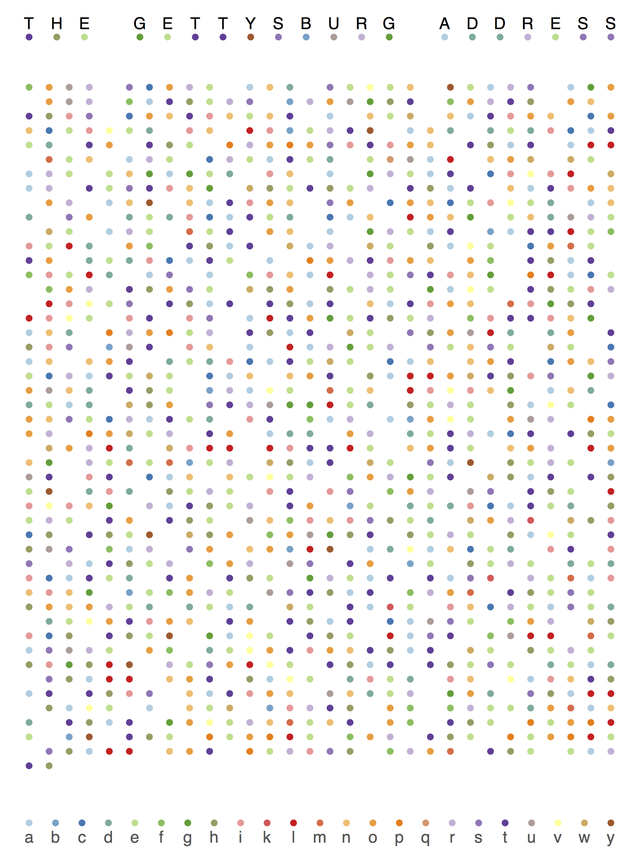
First time poster, in fact just downloaded R today and pretty excited. This guy on Reddit posted this image on Reddit/dataisbeautiful
He also posted the a direct link to the R script, and a Jupyter Notebook explaining the procedure, and said it would be pretty easy to replicate and manipulate using R.
That being said, I've never used R and I'm trying to figure this out but just not having any luck. I've downloaded the packages, at least I think I have, but still can't figure it out. I'd like to one, replicate this, and two make my own version of what he created.
What problem are you having with the script that you linked to? If you post the error you are getting and which line it happens at, it will be a lot easier to help you.
Command + Enter runs only the current line. If you want to run the whole script, highlight all of it and press command + Enter or use command + Shift + S
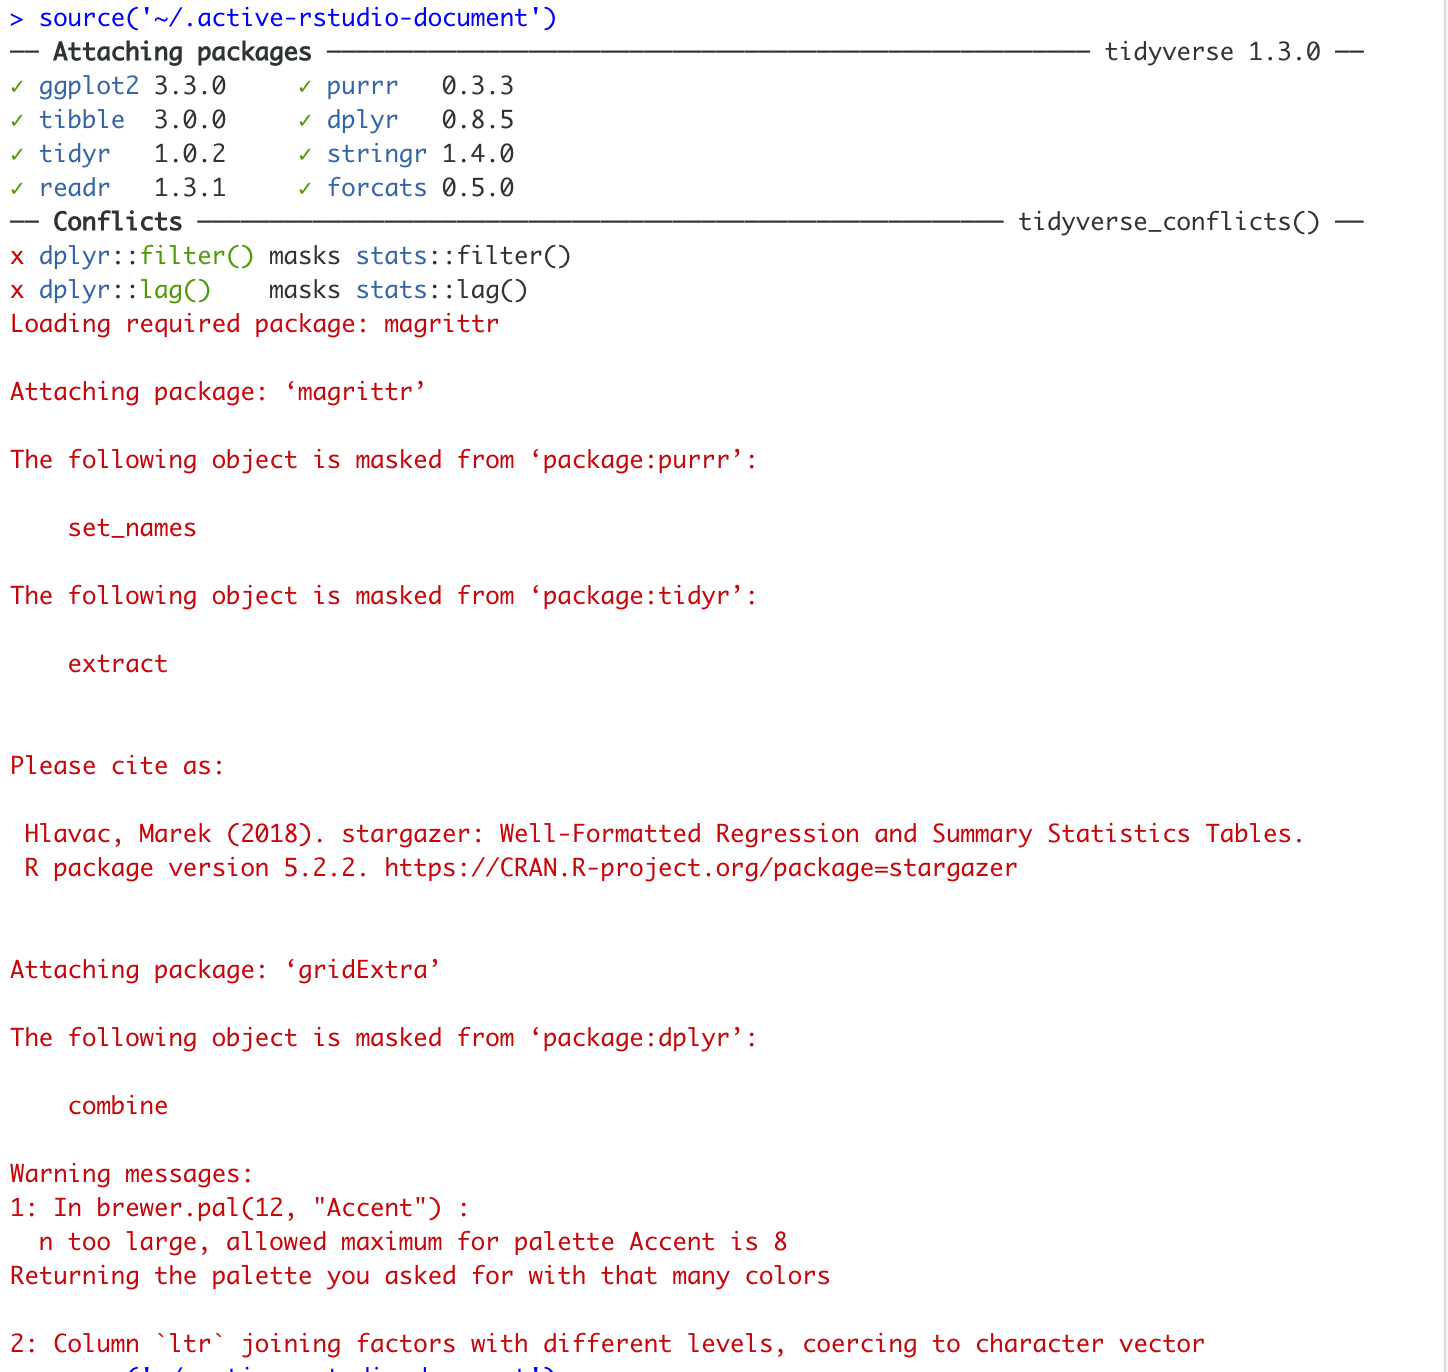
I've pressed (command+shift+S) and this is what I received. Not sure if I'm on the right track or not. Thanks for the help by the way. Much appreciated.
I don't see anything fatal in the image. Everything down to the "Warning messages:" is normal and the two warnings are not fatal. I am done for the day but post any Error messages you get and someone else may step in.
Those Warnings should not prevent the output of the graph, though it might not look exactly as expected. One of the warnings mentioned using fewer colors than requested.