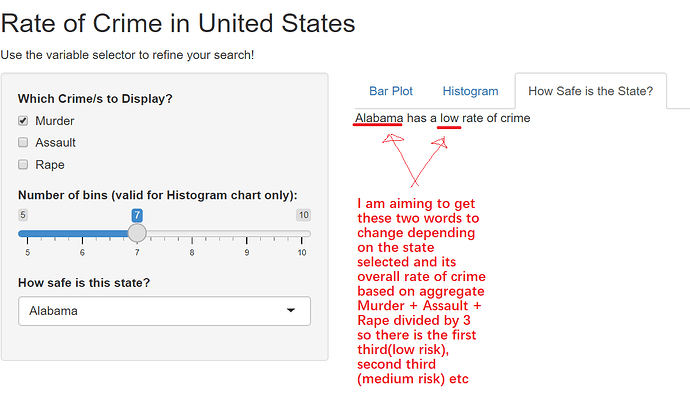
I am trying to incorporate a simple risk statement that just follows " (state name) has a low/medium/high rate of crime." This is my script I've written so far for my project.
library(shiny)
library(tidyverse)
library(ggplot2)

# Define UI for application that draws a histogram
ui <- fluidPage(

    # Application title
    titlePanel("Rate of Crime in United States"),
    p("Use the variable selector to refine your search!"),

    # Sidebar with a slider input for number of bins
    sidebarLayout(
        sidebarPanel(
            checkboxGroupInput("display_var",
                               "Which Crime/s to Display?",
                               choices = c("Murder" = "Murder",
                                           "Assault" = "Assault",
                                           "Rape" = "Rape"),
                               selected = "Murder"
            ),

            sliderInput("bins",
                        "Number of bins (valid for Histogram chart only):",
                        min = 5,
                        max = 10,
                        value = 7
            ),

            selectInput(
                "search", "How safe is this state?", choices = (attributes(USArrests)$row.names), selected = NULL)


        ),


        # Show a plot of the generated distribution
        mainPanel(
            tabsetPanel(
                tabPanel("Bar Plot", plotOutput("barplot")),
                tabPanel("Histogram", plotOutput("distPlot")),
                tabPanel("How Safe is the State?", textOutput("howsafe"))

            )
        )
    ))


# Define server logic required to draw a histogram
server <- function(input, output) {
    output$barplot <- renderPlot({

        marchoice <- req(input$display_var)
        sd <- setdiff(names(USArrests),marchoice)
        temp_df <- USArrests
        temp_df[,sd] <- 0

        counts <- temp_df$Murder + temp_df$Assault + temp_df$Rape
        names(counts) <- rownames(temp_df)
        barplot(counts,
                main="Aggregate Sum of Crime in the United States",
                xlab="State",
                ylab="Frequency",las=2,col=rgb(0.2,0.4,0.6,0.6))
    })

CategorisedMAR <- cut(USArrests$Murder + USArrests$Assault + USArrests$Rape, breaks=c(0,150,300,450), labels = c("Low", "Medium", "High"))

    output$howsafe <- renderText({
        if (input$search == "Low") {
            "________ has a low rate of crime"
        } else if (input$search == "Medium") {
            "________ has a mid-level rate of crime"
        } else if (input$search == "High") {
            "________ has a high rate of crime"
        }


    })

    output$distPlot <- renderPlot({

        #create new data based on the selection
        USArrests2 <-
            USArrests %>%
            #magic happens here with Unquoting the input variable with the bang-bang
            select(!!input$display_var) %>%
            #we create the new cumaltive column based on row sums where they are numeric
            mutate(cumulative_frequency = rowSums(across(where(is.numeric))))

        # create plot - we show the cum_freq
        ggplot(USArrests2, aes(cumulative_frequency)) + ggtitle("Histogram of Variable Frequency") +
            theme(plot.title = element_text(hjust = 0.5)) +
            geom_histogram(bins = input$bins,
                           fill = rgb(0.2,0.4,0.6,0.6),
                           colour = "grey30") +


            #we create a new label based on what has been selected
            xlab(str_c(input$display_var, collapse = " & ")) +
            theme_minimal()


    })

    output$searchstate <- renderDataTable(USArrests, options = list(pageLength = 5))
}


# Run the application
shinyApp(ui = ui, server = server)
My method I am hoping to use involves transforming the sum of the three variables (murder, assault and rape) into a categorical variable which is either low/medium/high as done using:
CategorisedMAR <- cut(USArrests$Murder + USArrests$Assault + USArrests$Rape, breaks=c(0,150,300,450), labels = c("Low", "Medium", "High"))
Disregard this section here because I'm not too sure how to go about it but I wrote something there as a placeholder whilst still being able to the run the code without error
   output$howsafe <- renderText({
        if (input$search == "Low") {
            "________ has a low rate of crime"
        } else if (input$search == "Medium") {
            "________ has a mid-level rate of crime"
        } else if (input$search == "High") {
            "________ has a high rate of crime"
        }
The breaks are simply the maximum number of crime divided by 3 and split into thirds. I then intend of using if statements that are dependent on the input from the user interface and if the state they selected has low risk, the output will simply print the text saying "state has a low rate of crime" else if the state selected has medium risk, the text will say "state has a medium rate of crime". Is there any advice or assistance in writing the code that can point me in the right direction? I have attached a photo of what I am trying to achieve. Thanks in advance ![]()
