Baseball Spray Chart Plotting

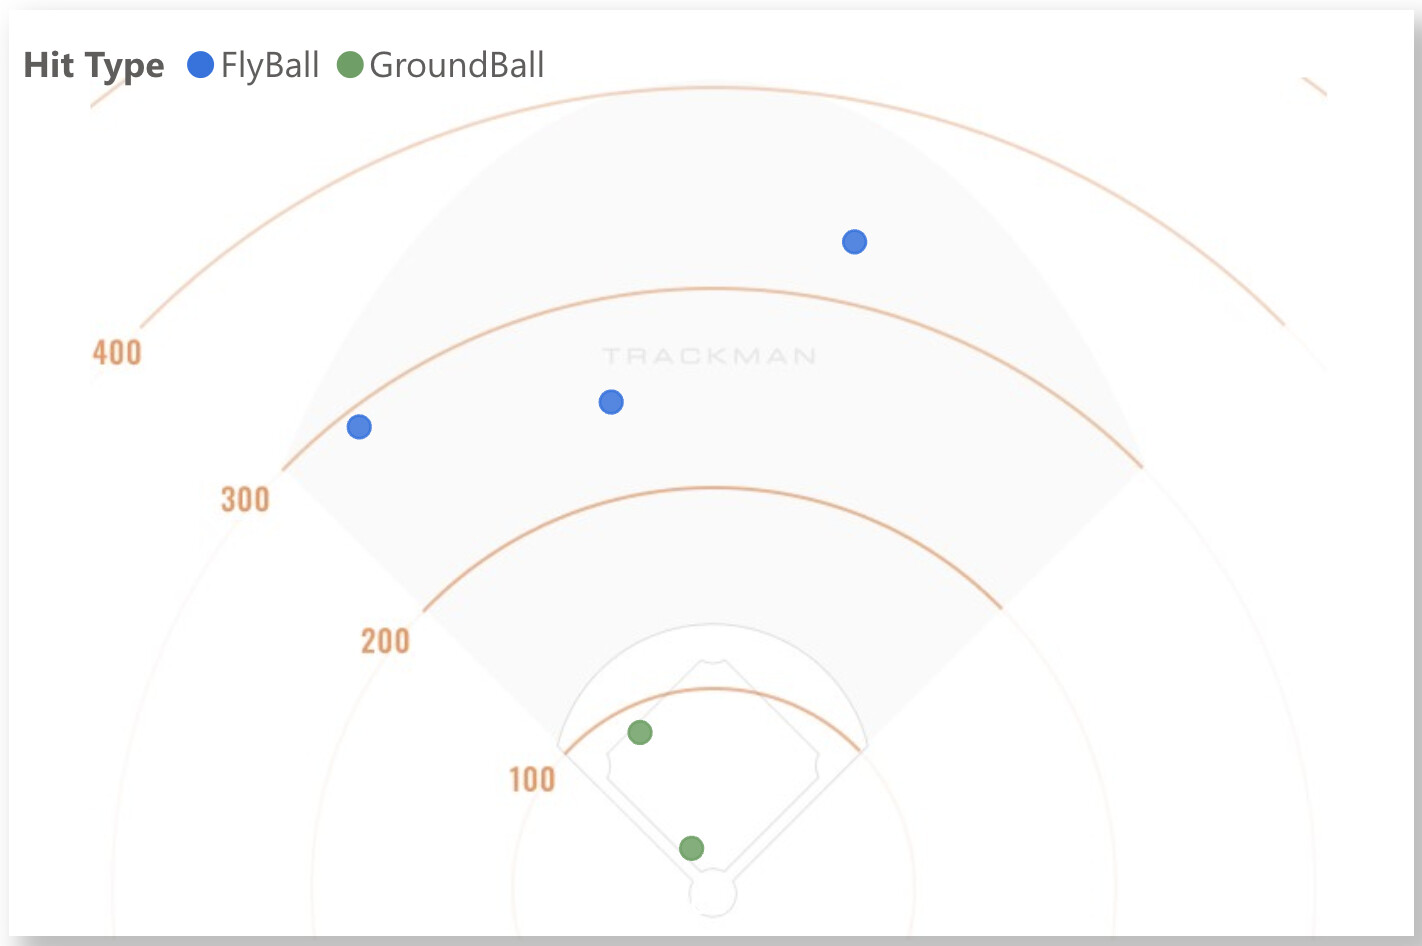
I am trying to plot a spray chart for baseballs in R. I am using Trackman data which does not have regular x and y coordinates like MLB does.

The x variable is directional info that is called "Bearing" and is measured in degrees. It is defined as: The horizontal angle formed by the intersection of the y-axis and a straight line drawn from the plate to the landing spot of the ball.

The Y variable would be "Distance" which is the distance the ball travels and is measured in feet.

The question is how to use Bearing and Distance together to plot where a batted ball lands on the field. Been searching for a long time and really having trouble.

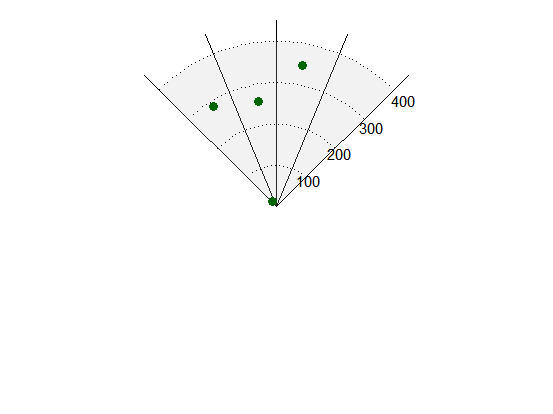
This is the code I have been playing with. Never mind that it creates a rectangle. I have not gotten to figure out how to create a real field yet. Just trying to plot for now. As info - the bearing down the 1B line is 45 degrees the bearing down the 3B line is -45 degrees, and the line directly up the middle would be zero.

ggplot(dfbb, aes(x = Bearing, y = Distance, color = PlayResult)) +
geom_point(alpha = 0.5) +
annotate("rect", xmin = -60, xmax = 60, ymin = 0, ymax = 400, fill = "transparent", color = "black") +
labs(title = "Baseball Spray Chart", x = "Bearing", y = "Distance (ft)")

Any help would be great!

Hi @mrax25. Are you able to share a subset of the data?

Would you work out a right angled triangle based on the one known side (the distance), and the three known angles (the bearing, the right angle and the other angle), then plot it from there?

Of course - data set from four balls in play are the spreadsheet from this link.

The two variables:
"Distance" is in excel column BB and "Bearing" is in excel column BD.

The following screenshot is how this data is charted on the Trackman website with a filter using the data in the spreadsheet.

The starting point at home plate should be a Distance of 0. Bearing for Trackman is 0 degrees on a line that goes from the back tip of home plate straight through the pitcher mound and through CF. The Trackman definition of Bearing is: The horizontal angle formed by the intersection of the y-axis and a straight line drawn from the plate to the landing spot of the ball. So Bearing on the foul line from back tip of home plate directly down the 1B line is 45 degrees. Back tip of plate directly down the 3B line is -45 degrees.

Having trouble with two things. 1. Charting it properly using Distance (in feet) and Bearing (in degrees). 2. Turning the square of the field the 45 degrees to make it look like a field. I have only been able to do it on a square.

Really appreciate the help.

This seems to be a good use case for a polar-coordinates plot (aka pie-chart).

baseball = tibble(
  Distance= c(348.43727, 259.46933, 15.89131, 286.71101),
  Bearing = c(10.339031, -9.65326, -32.219566, -32.320655))

ggplot(baseball, aes(x = Bearing, y = Distance)) + 
   # drawing an area for the playground
  annotate(geom = "rect", xmin = 45, xmax = -45, 
           ymin = 0, ymax = Inf,
           fill = "grey", alpha = 0.2) + 
   # add marks for the distances
  annotate(geom = "text", 
           x = rep(50, 4), y = c(100, 200, 300, 400), 
           label = c("100", "200", "300", "400")) +
   # add lines for the distance 
  annotate(geom = "segment",
           x = rep(-45,4), xend = rep(45, 4), 
           y = c(100, 200, 300, 400), yend = c(100, 200, 300, 400),
           linetype = "dotted") + 
   # show the results as points
  geom_point(colour = "darkgreen", size = 3) + 
   # convert to polar
  coord_polar(theta = "x", start = pi, clip = "on") + 
  theme_void() +  
   # adjust the axis 
  scale_x_continuous(limits = c(-180, 180),
                     breaks = c(-45, -22.5, 0, 22.5, 45 )) + 
   # show the breaks on the x-axis
  theme(panel.grid.major.x = element_line())

The problem is, I don't know how to draw only the upper half of the plot, so you need do cut-off what you don't need.

grafik

This is very helpful and appreciated. I am tinkering and trying to create the arc of the infield and an OF wall. An OF wall for example starts at 330 feet down the lines and 400 straight away CF. Either way, I am 1000 times closer to where I want to be with your help.

This topic was automatically closed 42 days after the last reply. New replies are no longer allowed.

If you have a query related to it or one of the replies, start a new topic and refer back with a link.