Hi!
I like how BarChart() automatically makes graphs and gives table with numeric info into console and I'm using it as such:
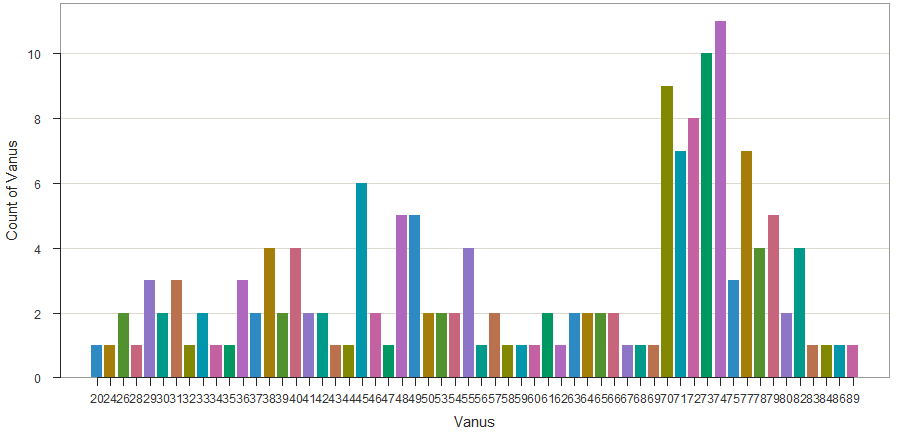
BarChart(age, data=numbers)
which gives me this:
Can I change the age paramater on the BarChart line so it would give me groups of ages e.g.:
BarChart( cut(age,breaks=c(1,39,49,59,69,79,89)), data=numbers)
??
Thanks!