Here's an approach relying more on drawing the elements in a single plot space. This implementation isn't particularly general but might be okay if the output is a one-off.
First, some fake data:
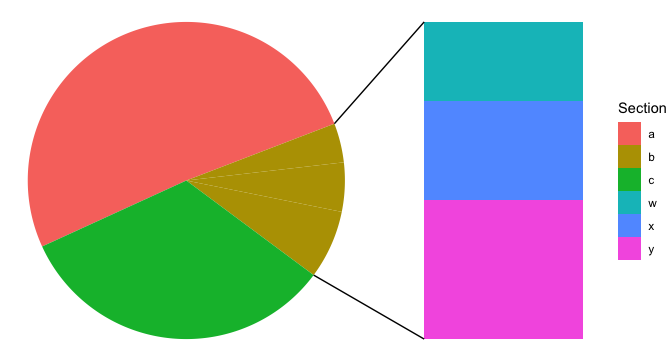
my_data <- data.frame(
  stringsAsFactors = F,
  Section = c("a", "b", "b", "b", "c"),
  Detail = letters[22:26],
  Amount = c(0.51, 0.04, 0.05, 0.07, 0.33)
)
Now, loading some libraries and noting the coordinates of the wedge edges.
library(ggplot2); library(ggforce); library(dplyr)
my_data_aug <- my_data %>%
  mutate(arc_start = cumsum(lag(Amount, default = 0)) * 2*pi - 2,
         arc_end   = cumsum(Amount) * 2*pi - 2,
         x_pos = 0 + cos(arc_start - pi/2),
         y_pos = 1 - sin(arc_start - pi/2))
The detail for the bar chart section:
my_data_detail <- my_data_aug %>%
  filter(Section == "b") %>%
  purrr::map_df(rev) %>%    # This reverses the order
  mutate(Amount_scaled = Amount / sum(Amount) * 2)
The detail for the segment lines:
my_data_lines <- my_data_aug %>%
  filter(Section == "b" | lag(Section == "b")) %>%
  slice(1, n())
Now, all together:
ggplot(my_data_aug) +
  geom_arc_bar(aes(x0 = 0, y0 = 1,
                   r0 = 0, r  = 1,
                   fill = Section,
                   start = arc_start,
                   end   = arc_end), color = NA) +
  geom_tile(data = my_data_detail,
            aes(x = 2,
                y = cumsum(Amount_scaled) - Amount_scaled/2,
                height = Amount_scaled, fill = Detail)) +
  annotate("segment",
           x = my_data_lines[1:2, "x_pos"],
           y = my_data_lines[1:2, "y_pos"],
           xend = 1.5,
           yend = c(2,0)) +
  coord_equal() +
  theme_void()