To help us help you, could you please prepare a reproducible example (reprex) illustrating your issue? Please have a look at this guide, to see how to create one:
We don't have access to your local files, we need sample data on a copy/paste friendly format, please read the guide on the link I gave you and try to make a proper reproducible example.
We can't copy from a screenshot and since you are asking people to invest their time helping you, the polite thing to do (here and in most programming related forums) is to provide a reproducible example to make helping you easier.
Even a try would be better than just posting a screenshot. I'm going to make the extra effort this time, since this is your first time here but have in mind that if you keep asking questions here, you are going to have to learn how to properly ask for help with a reprex at some point.
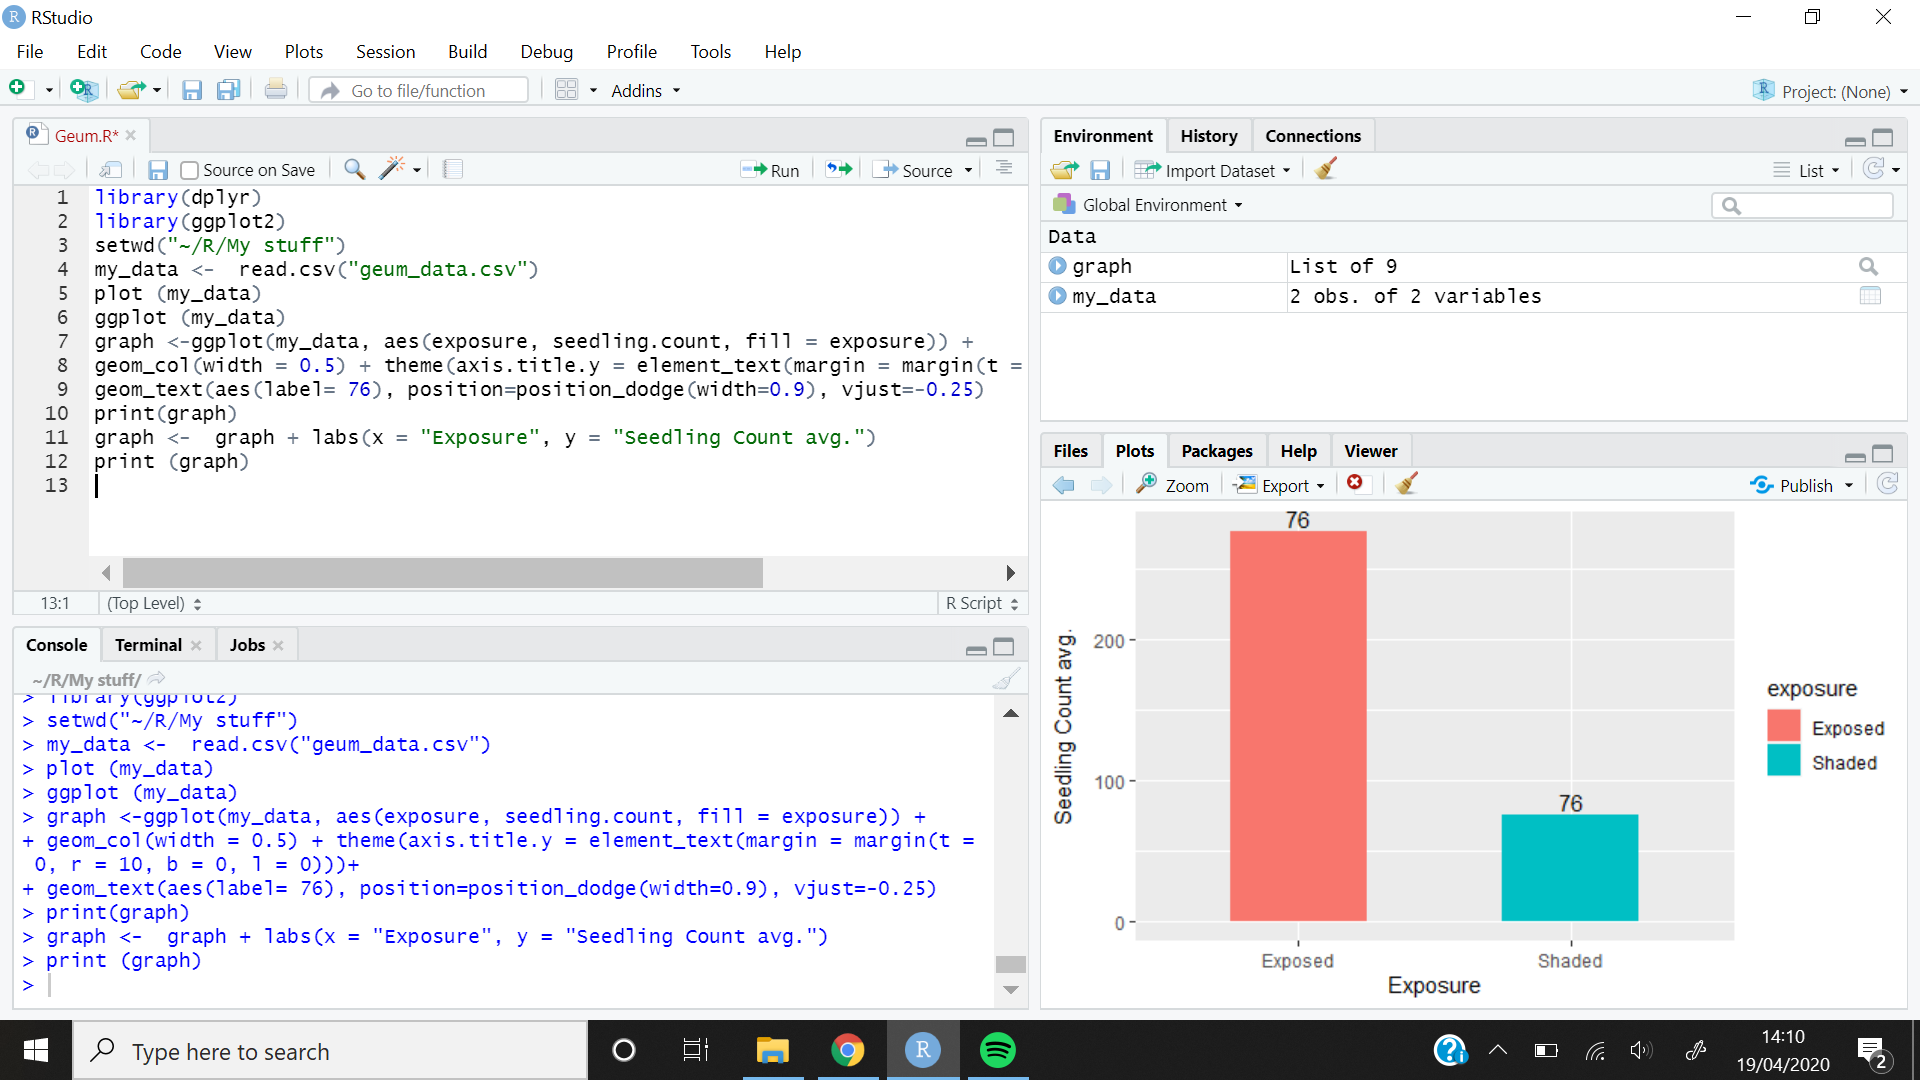
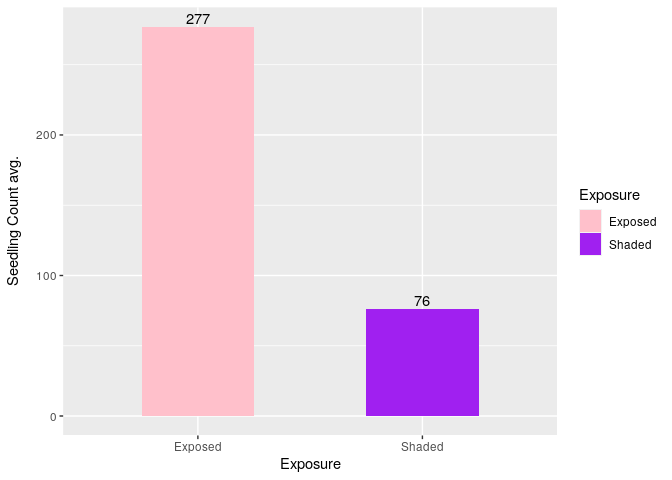
library(ggplot2)

# Sample data on a copy/paste friendly format
my_data <- data.frame(
  stringsAsFactors = FALSE,
          exposure = c("Shaded", "Exposed"),
    seedling.count = c(76, 277)
)

ggplot(my_data, aes(exposure, seedling.count, fill = exposure)) +
    geom_col(width = 0.5) +
    geom_text(aes(label = seedling.count),
              position=position_dodge(width=0.9),
              vjust=-0.25) +
    labs(x = "Exposure",
         y = "Seedling Count avg.",
         fill = "Exposure") +
    scale_fill_manual(values = c("pink", "purple")) +
    theme(axis.title.y = element_text(margin = margin(t = 0, r = 10, b = 0, l = 0)))
Created on 2020-04-19 by the reprex package (v0.3.0.9001)