Can you plese help me with this to scale the both X and Y Axis in the incresing Order of 1,2,3 until 8...and also bit of struggled in changing thoes axis labes with Xlab and y lab..
library(tidyverse)
library(ggplot2)
lm_fit_final2=lm(Log_Koc~E+S+A+B+V,data = Final_Master_Data_With_PFAS)
summary(lm_fit_final2)
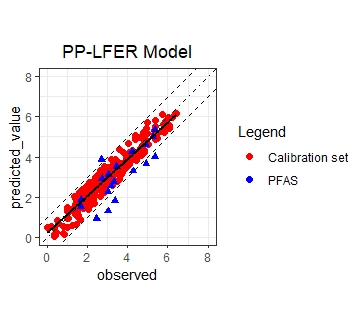
col2= c("Calibration set" = "red", "PFAS" = "blue")
predicted_Koc= data.frame(observed=Final_Master_Data_With_PFAS$Log_Koc,predicted_value=predict(lm_fit_final2,Final_Master_Data_With_PFAS),Category=Final_Master_Data_With_PFAS$Category,Chemicals=Final_Master_Data_With_PFAS$Chemicals)
ggplot(predicted_Koc,aes(observed,predicted_value))+geom_point()+geom_smooth(method = "lm",se= T)
ggplot(data = predicted_Koc,aes(x= observed, y = predicted_value))+geom_point(aes(shape = Category,color= Category),size= 2 ,colour= "black") + geom_point(aes(shape = factor(Category),color= factor(Category)),size= 2) +
geom_abline(slope = 1, intercept = 0,linetype ="dotdash") +
geom_abline(slope = 1, intercept = 1,
linetype = "dashed") +
geom_abline(slope = 1, intercept = - 1,
linetype = "dashed") +
scale_x_continuous(limits = c(0, 8)) +
scale_y_continuous(limits = c(0, 8)) +
geom_smooth(method = "lm", color = "black",se=F) +
coord_equal()+theme_classic()+ scale_colour_manual(values = col2)+labs(col="Legend") +guides(shape = FALSE) +ggtitle("PP-LFER Model")+ theme(plot.title = element_text(hjust = 0.5))