jdias
1
Is there any way to make a graph with axis labels of individual format (bold, color, ...)?
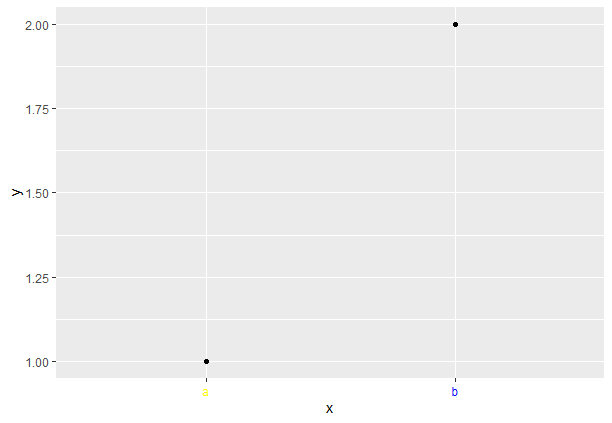
Imagine the following R code:
library(ggplot2)

data<-data.frame(x=c("a","b"),y=c(1,2))
ggplot(data)+geom_point(aes(x=x,y=y))
I would like that the label "a" had a different format (e.g. color) than label "b".
I don't think it is possible to do it natively but there is an extension package for that
Here is a minimally working example of what you want,
library(ggplot2)
data<-data.frame(x = c("a","b"), y=c(1,2))
ggplot(data) +
  geom_point(aes(x = x, y = y)) +
  theme(axis.text.x = element_text(colour = c("yellow", "blue")))
If you are going to be doing any kind of heavy customization of ggplots, you should check out the help file on theme()
?theme
system
Closed
4
This topic was automatically closed 7 days after the last reply. New replies are no longer allowed.
If you have a query related to it or one of the replies, start a new topic and refer back with a link.