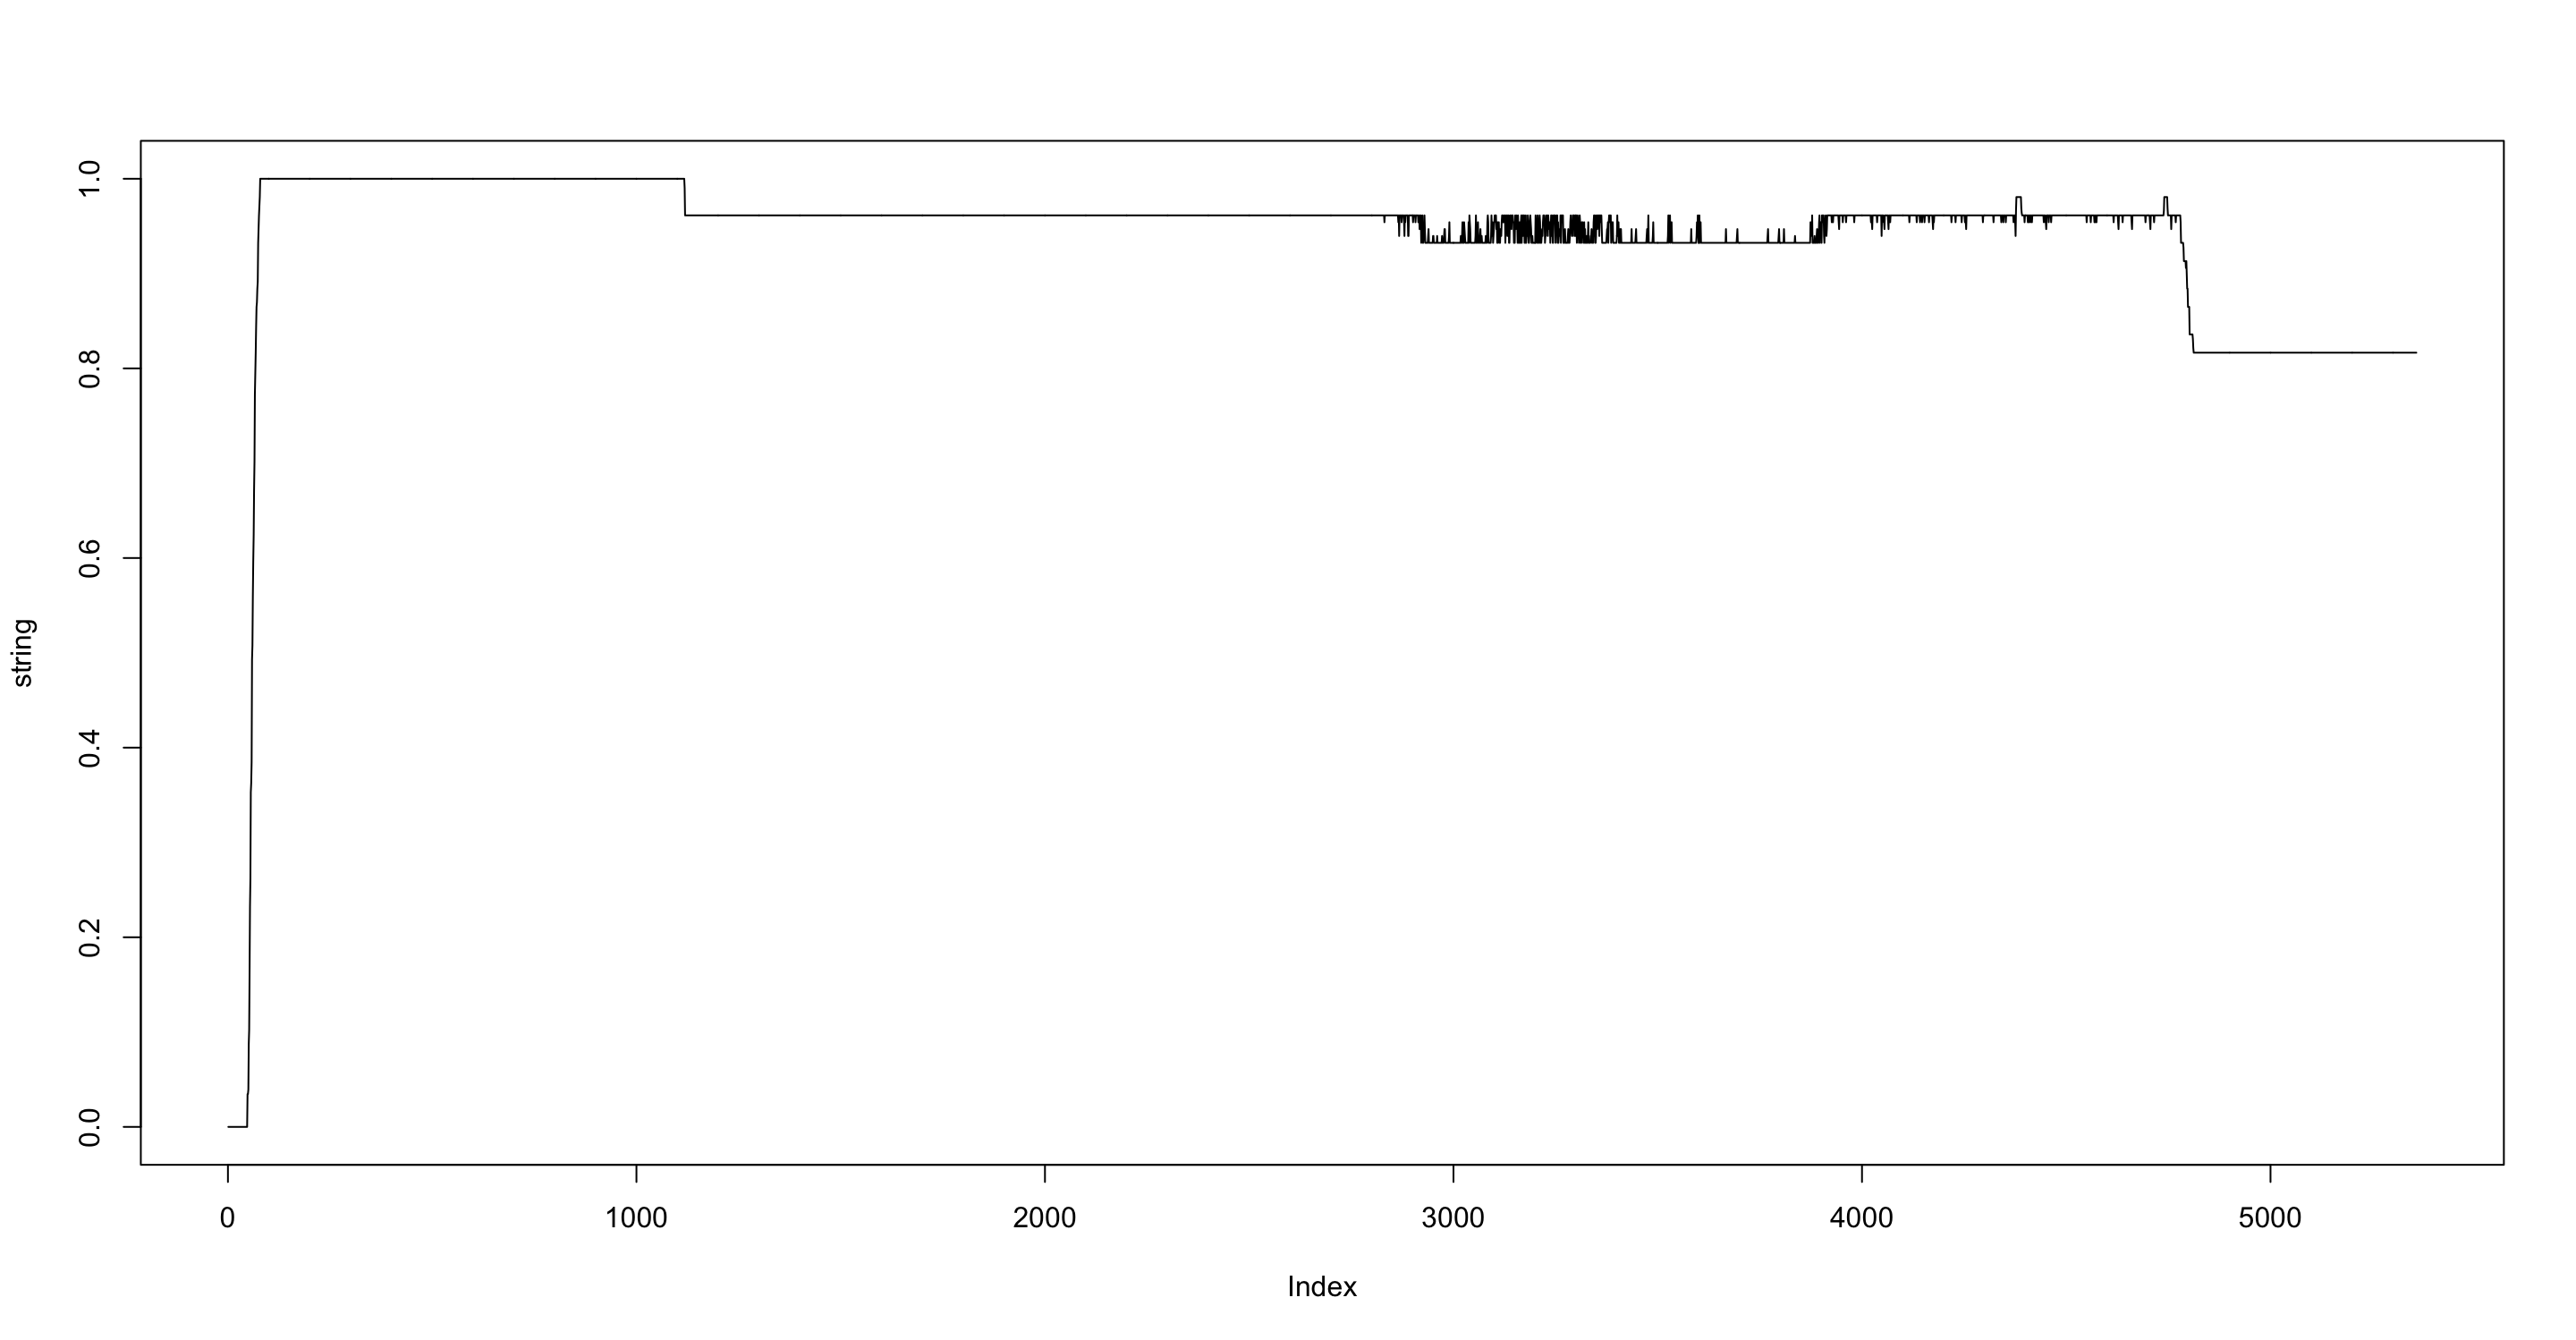
Hello, I have a long list of values. There is a bit of noise in (eg very small variations) in the data I've recorded. I was wondering if there's a way to remove this by, for example calculating the mean of the parts of my data where there is noise
You can see in the plot below, there is some small variations in the second part (x > 3000) of the my data. Is there a way I can just average these parts of my data, without affecting the other bits? So I'd only need to average data where there are small variations. Basically I'd need a low pass filter on this data. Here you can get the sample csv file. Just import it and then plot with