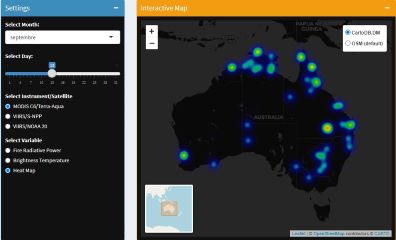
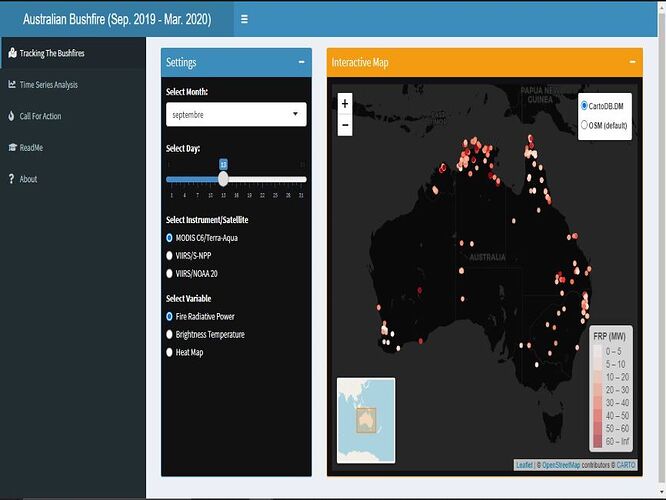
Australian BushFires (2019-2020)
Authors: Walid Ghariani
Abstract: Tracking and Analyzing the Spatial Temporal Variation of Australian Bushfire Season (2019-2020) Using MODIS and VIIRS Data. This app allows you to get an instant feedback about the impact and the spread of the fires.
Full Description: ## Framework
The app was developed as a final project for the scientific Graphics Course 04-GEO-SOS1, which is one of the courses that I took during the second semester of my MSc. in Applied Earth Observation and Geoanalysis (EAGLE) at JMU Wuerzburg.
About the data used in the App
NASA's Fire Information for Resource Management System (FIRMS) distributes Near Real-Time (NRT) active fire data within 3 hours of satellite observation from NASA's Moderate Resolution Imaging Spectroradiometer (MODIS) aboard the Terra and Aqua satellites and NASA's Visible Infrared Imaging Radiometer Suite (VIIRS) aboard the Suomi National Polar orbiting Partnership (Suomi NPP) and NOAA-20 satellites.
To download the data used in this app: https://firms.modaps.eosdis.nasa.gov/download/create.php
Keywords: “shiny” “spatial data” “environment” “leaflet” “data visualization”
Shiny app: https://walidgharianieagle.shinyapps.io/AustralianBushFires_2019-2020/
Repo: GitHub - WalidGharianiEAGLE/Aus_Bushfires_App: Tracking and Analyzing the Spatial Temporal Variation of Australian Bushfire 2019-2020 Using MODIS and VIIRS Data
RStudio Cloud: Posit Cloud
Thumbnail:

Full image:
