Hi, community
Is it possible to output asymmetric correlation coefficient matrix and draw the plot(with significance mark)?
I just meet this question when practicing R, and now could do symmetric correlation analysis only now. Take the mtcars data in R as example data is ok.
Thanks for all the help.
Can you say more about what that is ?
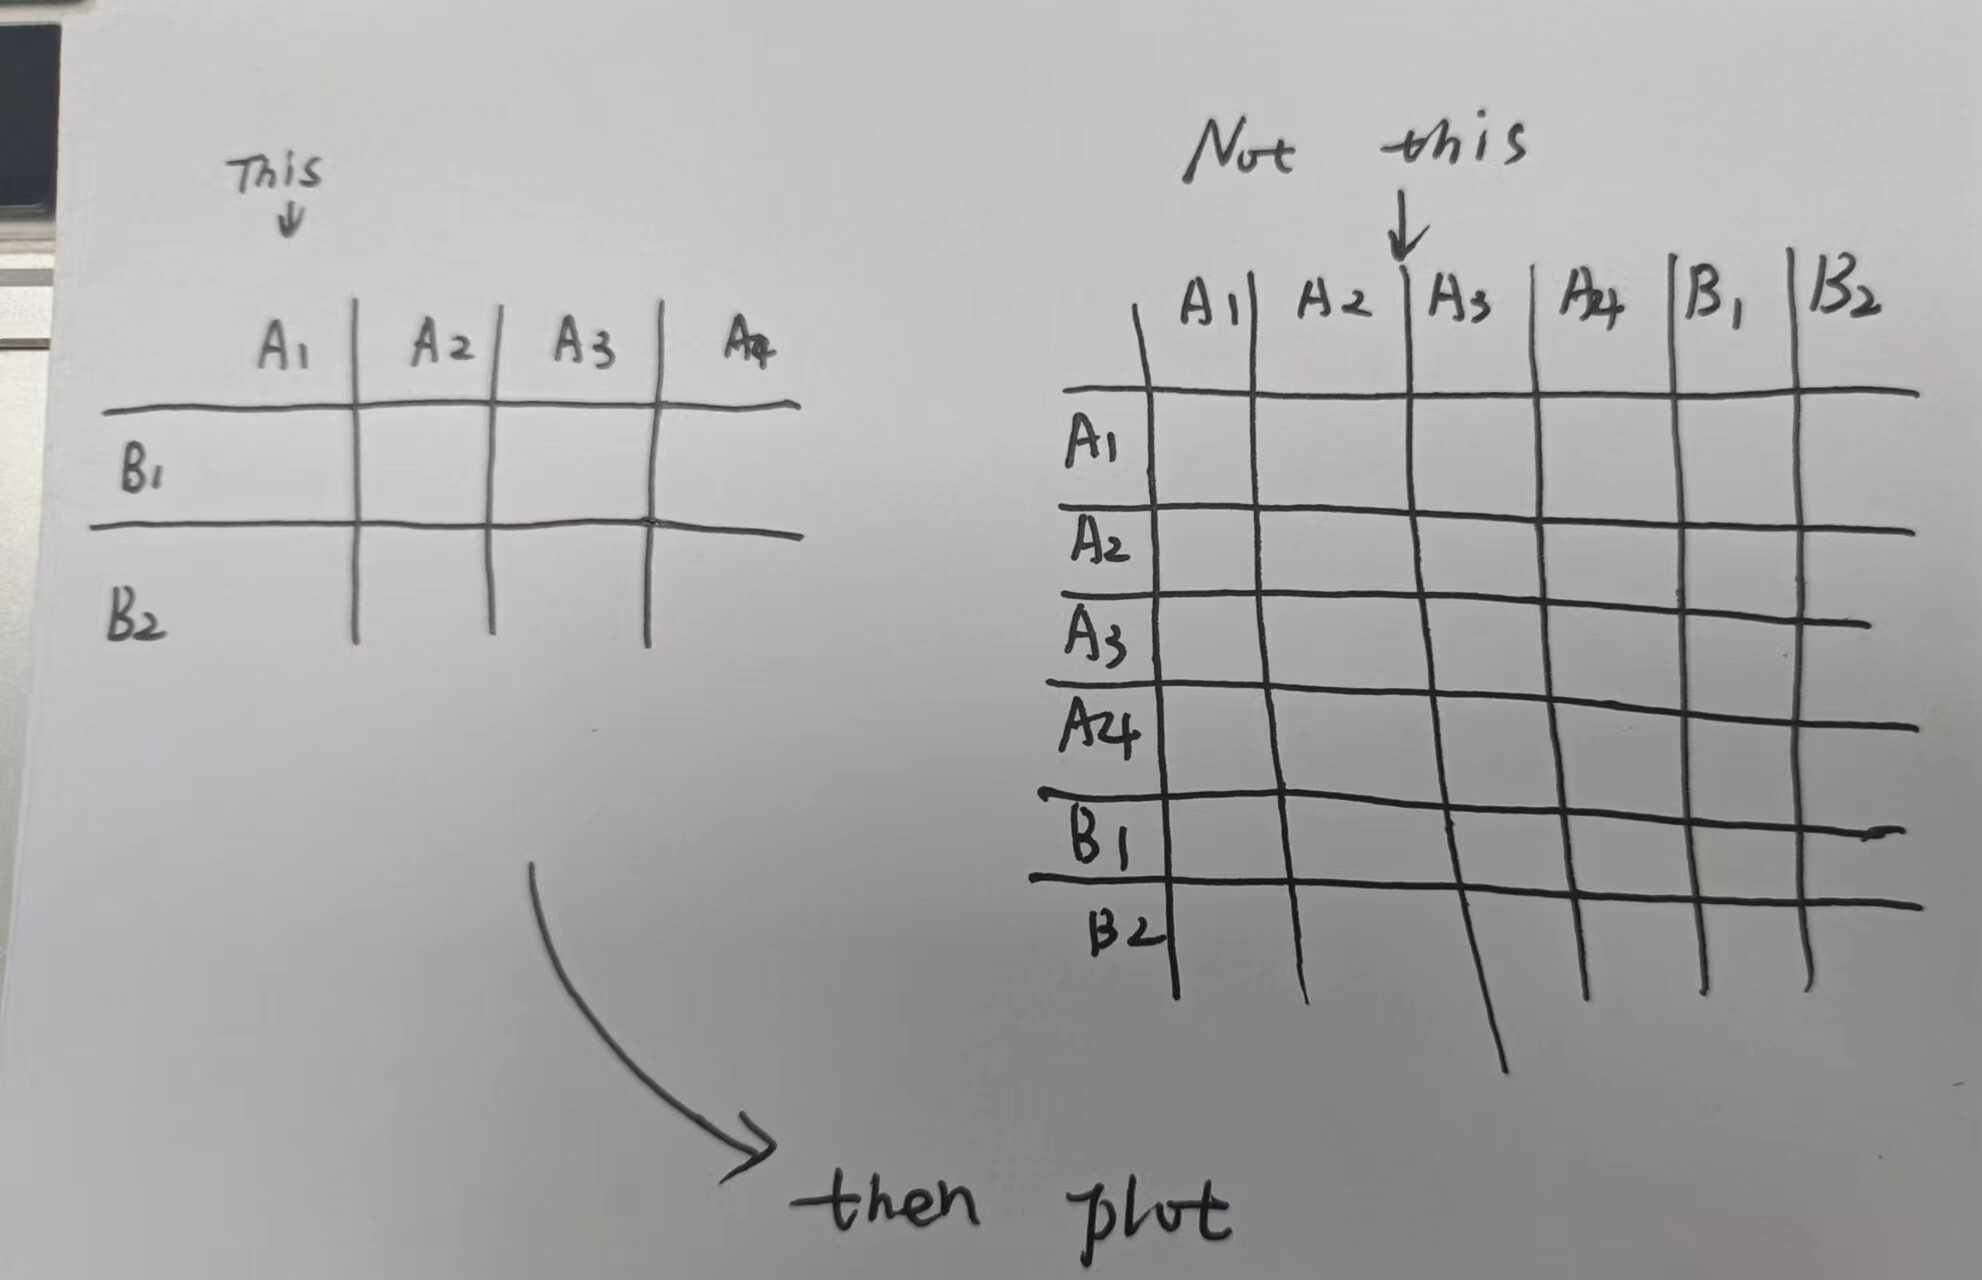
@nirgrahamuk like this
Matrix of correlation coefficients with different horizontal and vertical coordinates. How could we output this type matrix and plot?
library(dplyr)
library(tidyr)

# seems there can be a lot of example making prep code ...
set.seed(42)
(vols_1 <- rbind(expand.grid(LETTERS[1],1:4),
      expand.grid(LETTERS[2],1:2)) |> mutate(vols=100,
                                             mean=runif(6,0,5),
                                             sd=runif(6,0,3),
  vname = paste0(Var1,Var2)) |> tibble())

(vs1 <- split(vols_1,~vname) |>
    lapply(FUN=\(x){tibble(val = rnorm(n=x$vols,mean = x$mean,sd=x$sd))|>
        mutate(rn=row_number())}) )

(vs2 <- tibble(dplyr::bind_rows(vs1,.id = "vname")))

(example_inputs_1 <- pivot_wider(vs2,id_cols = "rn"
                                 ,names_from = "vname",
                                 values_from = val) |> select(-rn))
# end of example making prep

# a correlation result :
cor(example_inputs_1)
# are we just dropping columns and row ?
cor(example_inputs_1) |> as.data.frame() |> select(-B1,-B2) |> tibble::rownames_to_column() |>
  filter(startsWith(rowname,"B"))
1 Like
This topic was automatically closed 42 days after the last reply. New replies are no longer allowed.
If you have a query related to it or one of the replies, start a new topic and refer back with a link.