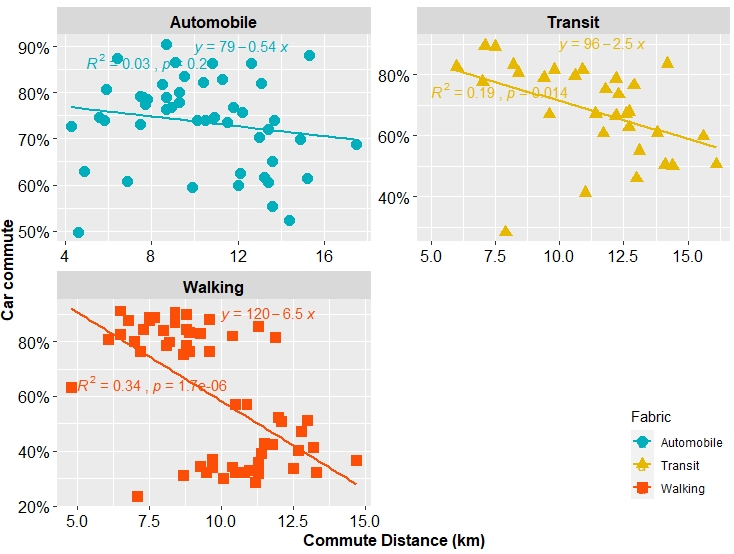
Again I've stumbled across a different problem. I want to assign different stat_smooth to different facets. In this case, i want to keep Walking and Transit fabrics as they are but make Automobile quadratic.
Below is my data:
 commutedistance carcommute  Fabric
3              11.3       35.9    Walking
4               8.0       84.0    Walking
7               7.9       28.3    Transit
8               6.0       82.6    Transit
11              7.1       23.3    Walking
12              4.8       63.0    Walking
15              9.3       34.2    Walking
16              6.1       80.7    Walking
19              8.7       31.1    Walking
20              7.2       76.1    Walking
23             10.1       29.9    Walking
24              8.1       78.4    Walking
27              9.5       32.2    Walking
28              7.0       79.8    Walking
31             11.3       31.7    Walking
32              9.3       82.9    Walking
35             10.4       34.1    Walking
36              8.2       79.7    Walking
39             11.2       28.5    Walking
40              8.9       76.3    Walking
43             13.3       32.2    Walking
44             10.4       81.9    Walking
47             14.7       36.6    Walking
48             11.3       85.5    Walking
51             11.3       34.4    Walking
52              8.9       83.3    Walking
55              9.7       36.7    Walking
56              6.5       91.0    Walking
59              9.7       33.8    Walking
60              6.5       82.5    Walking
63             12.8       47.0    Walking
64              8.8       89.9    Walking
67             13.2       41.1    Walking
68              9.6       87.8    Walking
71             12.5       33.6    Walking
72              8.4       90.4    Walking
75             11.4       38.9    Walking
76              8.4       86.7    Walking
79             10.5       32.1    Walking
80              7.3       84.4    Walking
83             10.8       32.2    Walking
84              7.5       88.7    Walking
87             11.0       32.9    Walking
88              7.5       87.5    Walking
91             11.0       41.2    Transit
92              7.5       89.1    Transit
95             11.5       42.6    Walking
96              6.8       87.6    Walking
99             11.8       42.2    Walking
100             8.8       84.2    Walking
103            12.7       40.2    Walking
104             7.7       88.5    Walking
107            12.0       59.9 Automobile
108            11.8       76.9 Automobile
111             9.9       59.4 Automobile
112            12.2       75.8 Automobile
115            10.5       57.0    Walking
116            11.4       67.1    Transit
119            10.9       56.9    Walking
120             9.6       76.2    Walking
123            12.7       67.9    Transit
124            12.2       78.7    Transit
127            11.7       60.7    Transit
128            11.8       75.2    Transit
131            12.1       50.6    Walking
132            11.9       81.5    Walking
135            13.8       61.0    Transit
136            12.9       76.5    Transit
139            12.6       67.2    Transit
140            14.2       83.5    Transit
143             6.9       60.7 Automobile
144             4.6       49.7 Automobile
147            13.0       70.4 Automobile
148             6.4       87.4 Automobile
151            13.2       61.6 Automobile
152             9.3       80.1 Automobile
155            12.7       62.7    Transit
156            10.6       79.6    Transit
175            14.1       50.4    Transit
176             9.6       67.0    Transit
191            14.4       50.1    Transit
192             8.2       83.1    Transit
195            13.0       51.0    Walking
196             8.7       75.1    Walking
207            12.0       52.1    Walking
208             8.8       78.3    Walking
223            13.0       46.0    Transit
224             7.0       77.7    Transit
227            10.1       74.0 Automobile
228             5.9       80.7 Automobile
231            12.1       62.4 Automobile
232            15.3       88.1 Automobile
235            12.2       66.4    Transit
236             9.8       81.6    Transit
247            15.6       59.8    Transit
248            10.9       81.5    Transit
267            14.4       52.4 Automobile
268             9.5       83.6 Automobile
271            13.1       55.0    Transit
272             8.4       80.5    Transit
275            15.2       61.5 Automobile
276            10.4       82.3 Automobile
279            12.3       73.5    Transit
280             7.1       89.5    Transit
283            10.5       74.0 Automobile
284             8.5       81.8 Automobile
287            16.1       50.6    Transit
288             9.4       79.0    Transit
291            13.4       60.5 Automobile
292            11.3       82.8 Automobile
295            13.6       55.3 Automobile
296             9.3       77.8 Automobile
299            17.5       68.7 Automobile
300            13.1       82.1 Automobile
315            14.9       69.9 Automobile
316             9.1       86.6 Automobile
319             8.7       78.9 Automobile
320             5.8       73.9 Automobile
323             8.9       76.8 Automobile
324             8.7       76.3 Automobile
327            13.4       72.0 Automobile
328            12.6       86.4 Automobile
331            13.7       74.1 Automobile
332            10.8       86.3 Automobile
335            10.9       74.6 Automobile
336             7.8       78.6 Automobile
339            13.6       65.0 Automobile
340             8.7       90.5 Automobile
343             7.5       73.2 Automobile
344             7.6       79.0 Automobile
351            11.5       73.6 Automobile
352             4.9       63.0 Automobile
355             5.6       74.7 Automobile
356             4.3       72.7 Automobile
359             7.7       77.4 Automobile
360             7.5       79.2 Automobile
My code also looks like this:
library(tidyverse)
library(ggpubr)
df %>%
  ggplot(aes(commutedistance, carcommute, color = Fabric, shape = Fabric)) +
  geom_point(size = 3.5)+
  stat_smooth(method = "lm", se = FALSE) +
  facet_wrap(~Fabric, ncol=2, scales = "free")+
  theme(strip.text.x = element_text(size = 12, colour = "black", angle = 0, face = "bold"))+
  theme(axis.title.x = element_text(color="black", size=12, face="bold"),
        axis.title.y = element_text(color="black", size=12, face="bold"))+
  theme(axis.text.x = element_text(colour = "black", size = 12),
        axis.text.y = element_text(colour = "black", size = 12))+
  scale_y_continuous(labels = function(x) paste0(x, "%"))+
  labs(x = "Commute Distance (km)",
       y = "Share of commuters getting to work by car")+
  theme(legend.position = c(1, 0),
        legend.justification = c(1, 0))+
  stat_cor(
    aes(label = paste(..rr.label.., ..p.label.., sep = "~`,`~")),
    label.x = 5
  )+
  stat_regline_equation(label.x = 10, label.y = 90)+
  scale_color_manual(values = c("#00AFBB", "#E7B800", "#FC4E07"))+
  scale_fill_manual(values = c("#00AFBB", "#E7B800", "#FC4E07"))
After running the code above,I've got the following graph. How can keep transit and walking as linear regression models and convert automobile regression into quadratic. I would greatly appreciate your input!!!