Ask for advice on 'geom_tile' results

I have a dataframe like below.

# A tibble: 2,500 x 3
ipv   lat   lon
<int> <dbl> <dbl>
1   230  53.3  76.8
2   222  53.3  76.8
3   258  53.3  76.8
4   232  53.3  76.8
5   207  53.3  76.8
6   238  53.3  76.8
7   218  53.3  76.8
8   218  53.3  76.8
9   249  53.3  76.8
10   237  53.3  76.9
# … with 2,490 more rows

I drew a picture for this dataframe using the code below.

p1 <- ggplot(data=df, mapping=(aes(x=lon,y=lat,colour=ipv,fill=ipv))) +
  geom_tile() +
  coord_fixed()
ggsave("test.png", plot=p1)

As a result, the figure below was created.

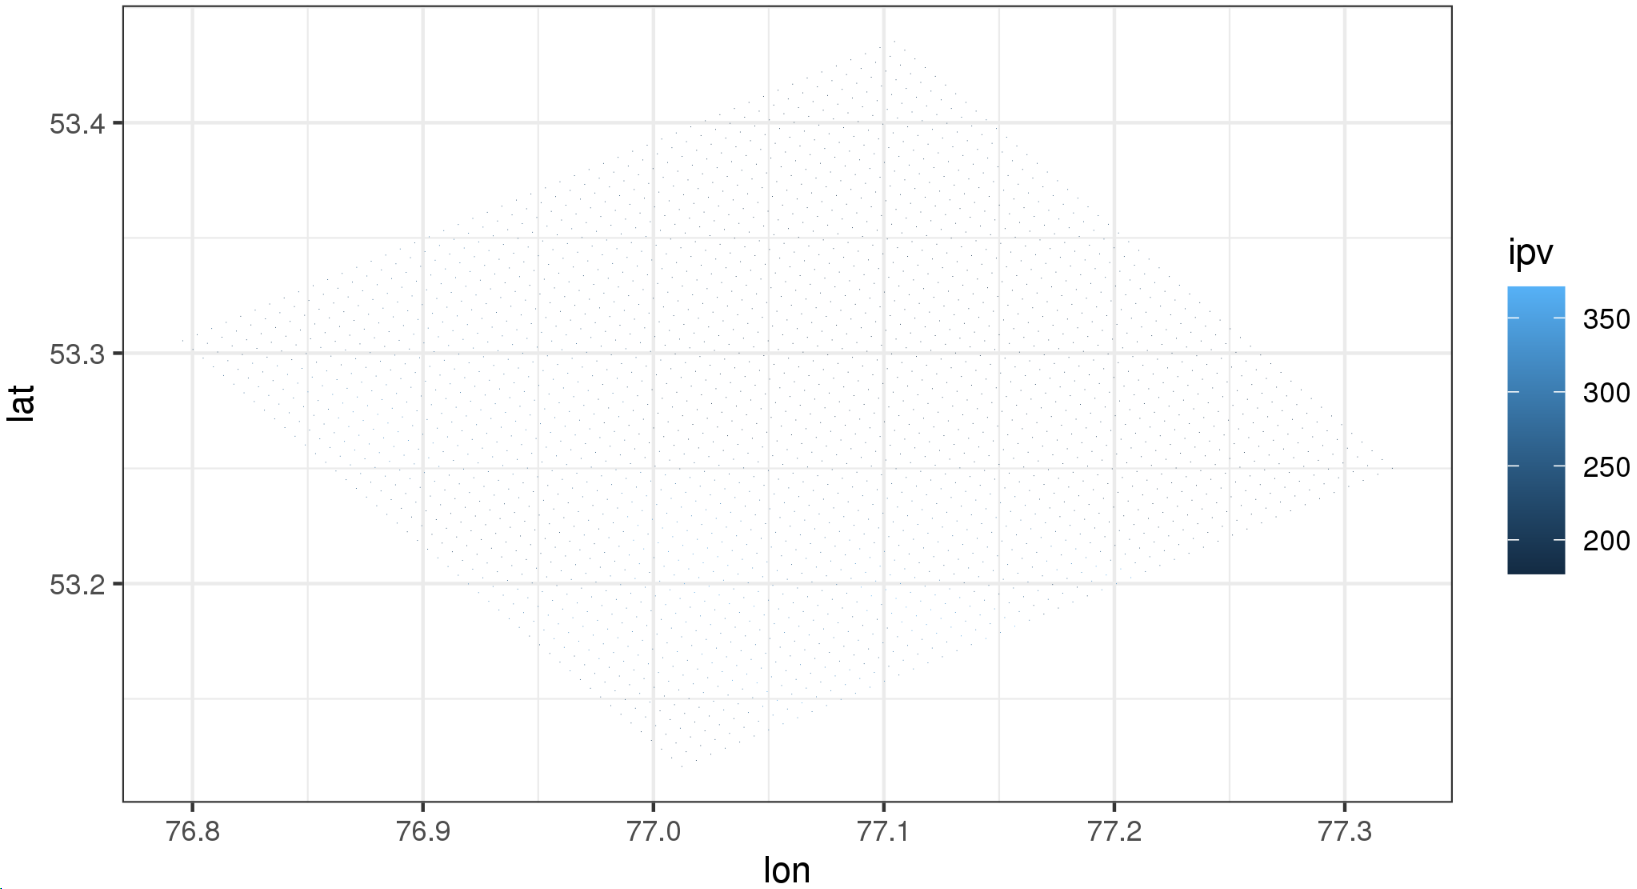
When using geom_tile, why does it come out as a dot instead of a tile?

Thanks for reading.

Hello.
Thanks for providing code , but you could take further steps to make it more convenient for other forum users to help you.

Share some representative data that will enable your code to run and show the problematic behaviour.

You might use tools such as the library datapasta, or the base function dput() to share a portion of data in code form, i.e. that can be copied from forum and pasted to R session.

Reprex Guide

This topic was automatically closed 21 days after the last reply. New replies are no longer allowed.

If you have a query related to it or one of the replies, start a new topic and refer back with a link.