I am learning this website:
https://rpubs.com/rpadebet/269829
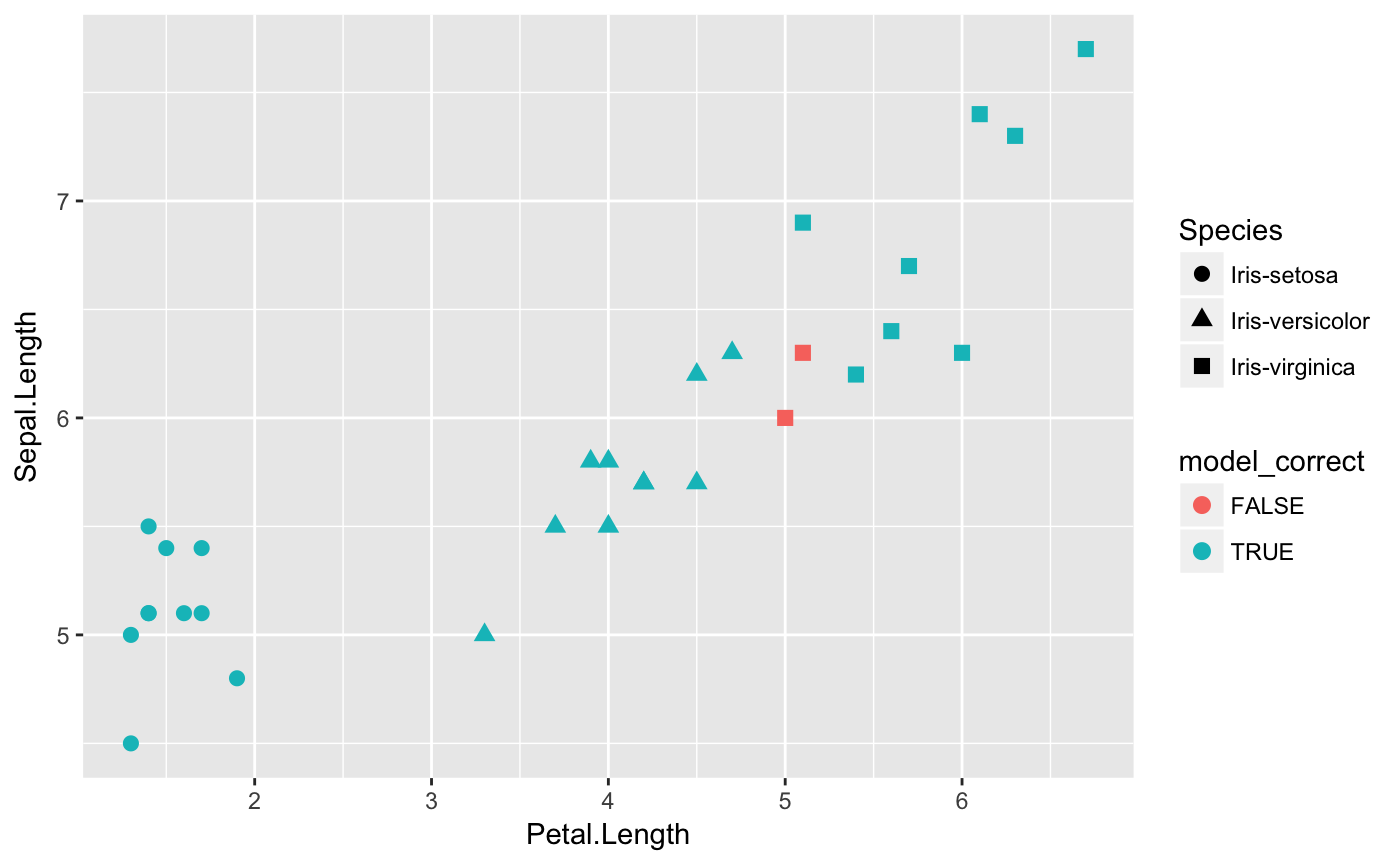
But this website doesn't have R code for this figure. How to replicate this figure below?
I am learning this website:
https://rpubs.com/rpadebet/269829
But this website doesn't have R code for this figure. How to replicate this figure below?
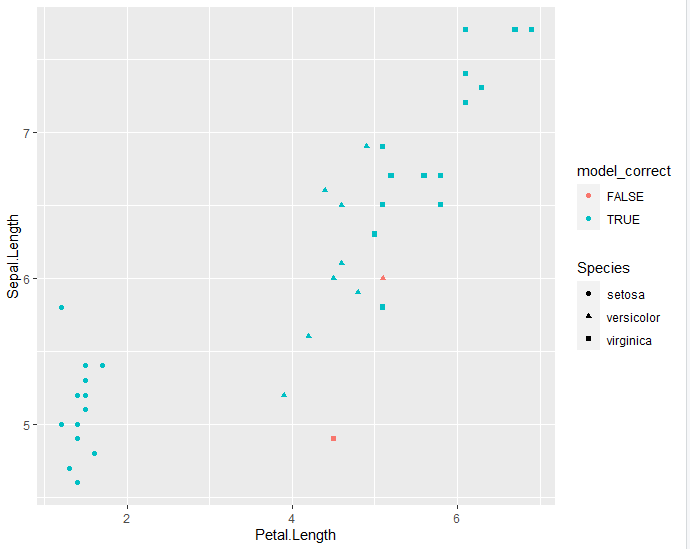
It would be something like this -- I have made the models up myself.
library(tidymodels)
library(tidyverse)
library(ranger)

split <- initial_split(iris)

test_df <- testing(split)
train_df <- training(split)


fit1 <- ranger(Species ~ Petal.Length, data = test_df)
summary(fit1)


new_df <- test_df %>%
  mutate(pred = predict(fit1, test_df)$predictions,
         model_correct = pred == Species)

ggplot(new_df, aes(Petal.Length, Sepal.Length, colour = model_correct, shape = Species)) +
  geom_point()
This topic was automatically closed 7 days after the last reply. New replies are no longer allowed.
If you have a query related to it or one of the replies, start a new topic and refer back with a link.