I have an example with my own data that I think it's similar to what you want to do at the end.
library(tidyverse, quietly = TRUE)
library(lubridate)
conection_speed <- data.frame(
time = c("2019-01-09 00:01:30", "2019-01-09 01:01:27",
"2019-01-09 02:01:18", "2019-01-09 03:01:05",
"2019-01-09 04:01:36", "2019-01-09 05:01:27", "2019-01-09 06:01:12",
"2019-01-09 07:02:11", "2019-01-09 08:01:17",
"2019-01-09 14:00:33", "2019-01-09 15:00:37", "2019-01-09 16:00:39",
"2019-01-09 17:00:36", "2019-01-09 18:00:41",
"2019-01-09 19:00:33", "2019-01-09 20:00:33", "2019-01-09 21:00:35",
"2019-01-09 22:00:34", "2019-01-09 23:00:34",
"2019-01-10 00:00:37", "2019-01-10 01:01:22", "2019-01-10 02:00:39",
"2019-01-10 03:00:34", "2019-01-10 04:00:36", "2019-01-10 05:00:34",
"2019-01-10 06:00:38", "2019-01-10 07:00:37",
"2019-01-10 08:00:37", "2019-01-10 09:00:13", "2019-01-10 10:01:16",
"2019-01-10 11:00:33", "2019-01-10 12:00:46",
"2019-01-10 13:00:32", "2019-01-10 14:00:31", "2019-01-10 15:00:36",
"2019-01-10 16:00:32", "2019-01-10 17:00:33",
"2019-01-10 18:00:32", "2019-01-10 19:00:34", "2019-01-10 20:00:34",
"2019-01-10 21:00:32", "2019-01-10 22:00:32", "2019-01-10 23:00:30",
"2019-01-11 00:00:31", "2019-01-11 01:00:31",
"2019-01-11 02:00:33", "2019-01-11 03:00:38", "2019-01-11 04:00:32",
"2019-01-11 05:00:32", "2019-01-11 06:00:32",
"2019-01-11 07:00:37", "2019-01-11 08:00:30", "2019-01-11 09:00:32",
"2019-01-11 10:01:19", "2019-01-11 11:00:31",
"2019-01-11 12:00:32", "2019-01-11 13:00:30", "2019-01-11 14:00:32",
"2019-01-11 15:00:31"),
download_speed = c(1.39, 1, 1.7, 1.67, 2.11, 1.12, 2.23, 0.94, 1.18, 7.94,
18.64, 2.1, 17.74, 19.91, 21.06, 21.12, 20.32, 20.96,
4.05, 19.14, 17.13, 14.63, 19.28, 21.03, 20.68, 21.23, 4.07,
18.61, 0, 1.19, 21.23, 18.73, 20.62, 20.63, 17.1, 20.67,
20.02, 21.32, 21.01, 20.69, 21.03, 20.5, 20.9, 19, 20.95,
20.88, 19.24, 21.2, 20.91, 21.36, 17.24, 21.12, 20.8, 2.7,
21.47, 20.86, 20.91, 20.57, 21.09)
)
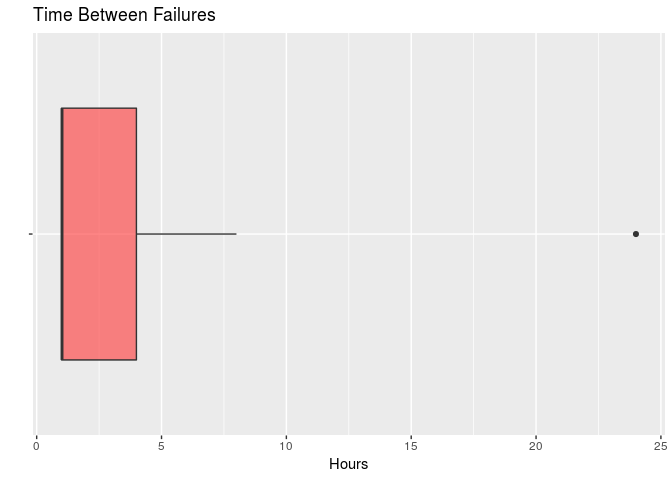
conection_speed %>%
mutate(event_type = ifelse(download_speed <= 8, 'fault', 'normal')) %>%
filter(event_type == 'fault') %>%
mutate(lag_time = lag(time), tbf = as.period(interval(lag_time, time), unit = 'seconds') / 3600) %>%
tail(-1) %>%
ggplot(aes(x = '', y = tbf)) +
geom_boxplot(fill = '#FF303094') +
coord_flip() +
labs(title = 'Time Between Failures',
x = '',
y = 'Hours')