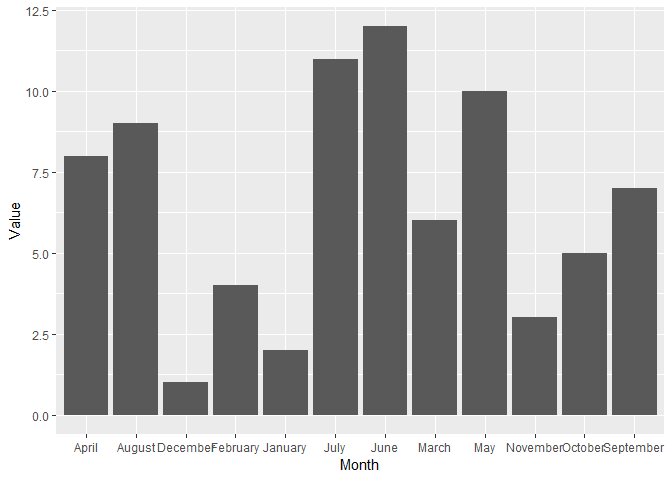
I have the following ggplot output in a Shiny App:
The plot Months on the x-axis are arranged in alphabetical order and the following code is used to render the plots:
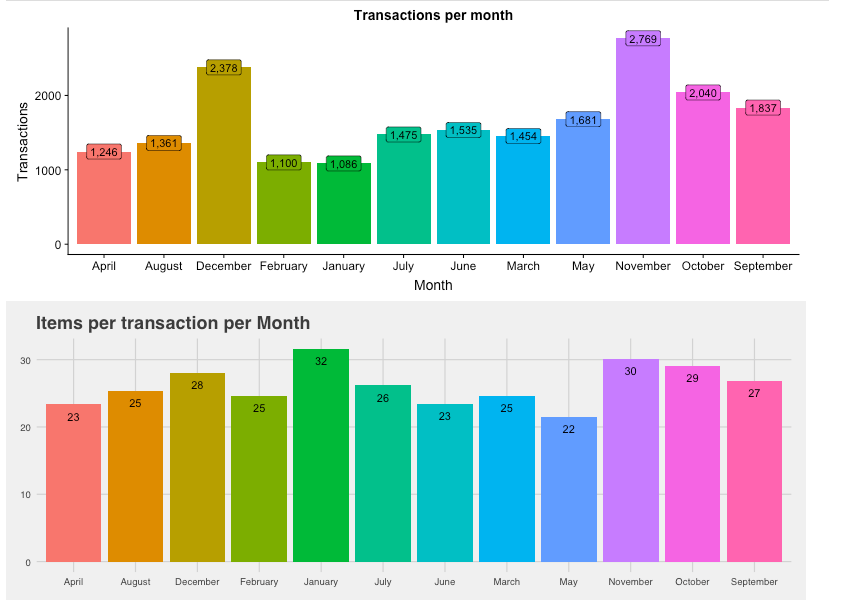
  ## Graph of transactions per month
  output$TransMonthPlot <- renderPlot({
    req(credentials()$user_auth)
    withProgress(message = 'Calculation in progress',
                 detail = 'This may take a while...', value = 0, {
                   for (i in 1:15) {
                     incProgress(1/15)
                     Sys.sleep(15)
                   }

                 })

    g1 <-  MBA_Online() %>%

      filter(transDate >= input$dRange[1] & transDate <= input$dRange[2]) %>%
      dplyr::group_by(Month) %>%
      dplyr::summarize(Transactions = n_distinct(Transaction)) %>%
      ggplot(aes(x=Month, y = Transactions, fill = Month)) +
      geom_bar(stat="identity") +
      geom_label(aes(label= format(Transactions, big.mark = ",")))+
      theme(legend.position="none")+
      theme(panel.background = element_blank())+
      labs(x = "Month", y = "Transactions", title = "Transactions per month")

    ## Plot items per transaction per month
    x1 <-  MBA_Online() %>%

      filter(transDate >= input$dRange[1] & transDate <= input$dRange[2]) %>%
      group_by(Month) %>%
      dplyr::summarise(Count = n())

    x2 <- MBA_Online() %>%

      filter(transDate >= input$dRange[1] & transDate <= input$dRange[2]) %>%
      group_by(Month, Transaction) %>%
      dplyr::summarise(n_distinct(Transaction)) %>%
      dplyr::summarise(Count =n())

    x3 <- data.frame(x1, x2[2], x1[2]/x2[2])

    colnames(x3) <- c("Month", "Line", "Unique", "Items.Trans")

    g2 <- ggplot(x3,aes(x=Month, y = Items.Trans, fill=Month))+
      theme_fivethirtyeight()+
      geom_bar(stat = "identity")+
      theme(legend.position = "none")+
      geom_text(aes(label=round(Items.Trans,0)), vjust=2) +
      labs(
        x="Month",
        y="Items",
        title = paste(
          "Items per transaction per Month"
        )
      )

    grid.arrange(g1,g2)

  }, height = 600, width = 800)
How can i arrange the x-axis in order of rising month starting with January, February, March ... to December?
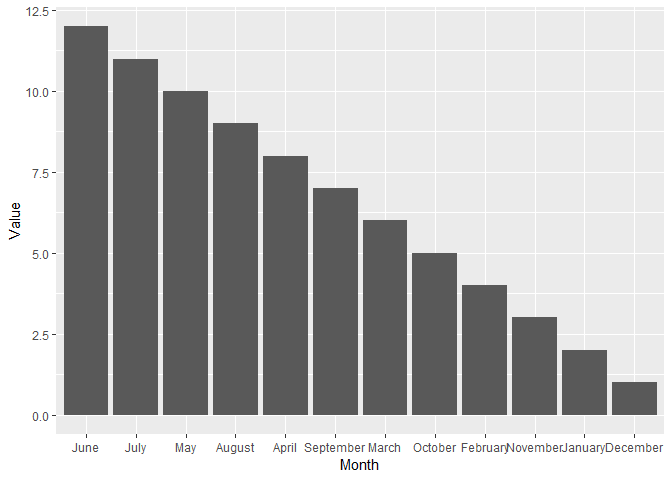
How can i also arrange the x-axis to show the plots either in ascending or descending order to the y-axis value?