jak123
January 28, 2022, 8:13am
1
Hi R com
have the following code:
new_df %>%
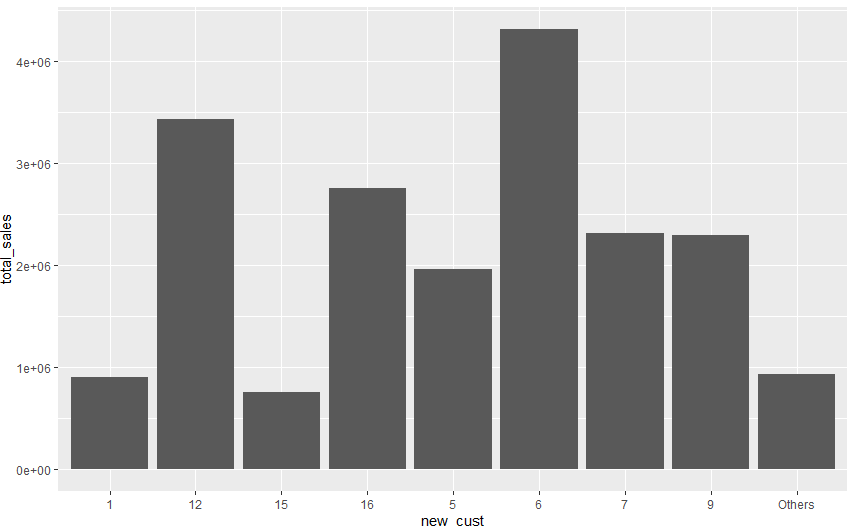
and used the arrange(desc(.) to arrange the plot but it looks like this:
Thanks
depending on your defaults the group_by may be retained by summarise meaning subsequent slice may not be as expected. Try manually ungrouping after the summarise to be explicit.
new_df %>%
group_by(new_cust) %>%
summarise(total_sales = sum(total_sales, na.rm=TRUE),
freq = n()) %>%
ungroup() %>%
arrange(desc(total_sales)) %>%
slice(1:10) %>%
ggplot (aes(new_cust, total_sales)) +
geom_bar(stat="identity")
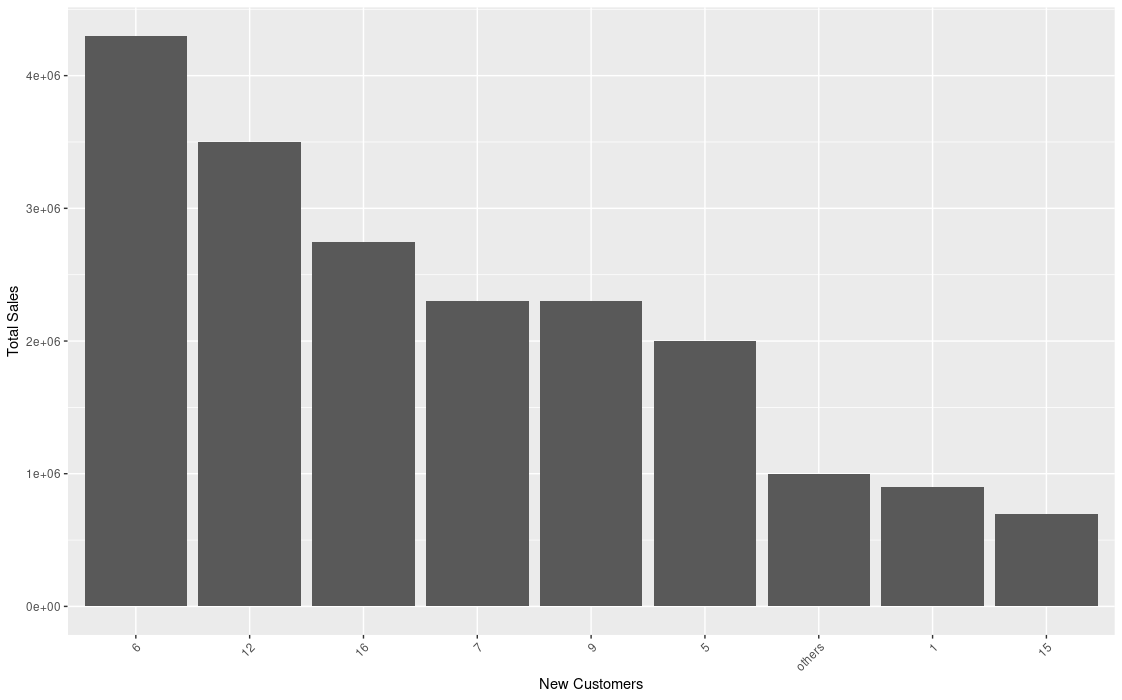
Since this is using geom_bar(), I believe there is a simple fix; in ggplot() set the reorder, ie;
:
ggplot (aes(reorder(new_cust, -total_sales),total_sales)) +
:
The -total_sales indicates we want the bars in descending order.
NOTE: You might need to set xlab() and ylab() to get your axis labels the way you want them
Something like: