ggplot(data=daily_activity_new) +
geom_bar(aes(x=day_of_the_week)) +
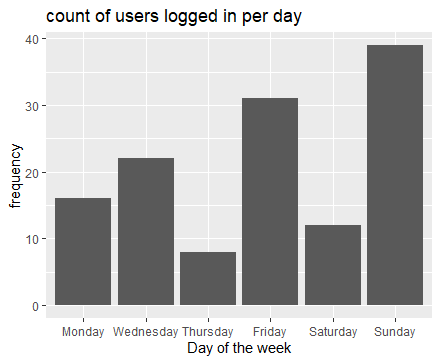
labs(title="count of users logged in per day", x="Day of the week", y="frequency")
output : weekdays are displayed in the format 'Fri Mon Sat Sun thurs Tues Wed' on x axis
I want it to be displayed in either of the below formats
In order sun mon tue etc
desc based on count/frequency
I tried using fact() methods to reorder or arrange in desc but it's not working. the error says fact cant be applied on dataframe.
can anyone please help and let me know how to go about this?
library(tidyverse)
daily_activity_new <- data.frame(day_of_the_week=c("Saturday","Monday" ,"Thursday", "Wednesday",  "Friday", "Sunday"),
                                  freq=c(12,16,8,22,31,39))

# For oder the days
daily_activity_new$day_of_the_week <- factor(daily_activity_new$day_of_the_week, c("Monday", "Tuesday", "Wednesday", "Thursday","Friday","Saturday", "Sunday"))

ggplot(data=daily_activity_new) +
  geom_col(aes(x=day_of_the_week, y=freq)) +
  labs(title="count of users logged in per day", x="Day of the week", y="frequency")
Maybe is better if you put the data. Because if you want order by desc the frequency, so will change the days order.
Thanks for your input. I have actually figured a way out to display it in asc or desc now. However unable to plot it in the order of days of the week. eg sun mon tue wed etc. Below is my modified code
ggplot(daily_activity_new, aes( x = reorder(day_of_the_week,day_of_the_week,function(x)-length(x)))) + geom_bar()
Before the plot you could set the order of days, like this :
# in this order appear in the plot.
daily_activity_new$day_of_the_week <- factor(daily_activity_new$day_of_the_week, c("Monday", "Tuesday", "Wednesday", "Thursday","Friday","Saturday", "Sunday"))