How do I show the approximate symbol in a ggplot label?
Typing %~~% without the quotes won't even run in the reprex! R says unexpected SPECIAL which makes sence.
library(ggplot2)
p <- ggplot() +
theme_void()
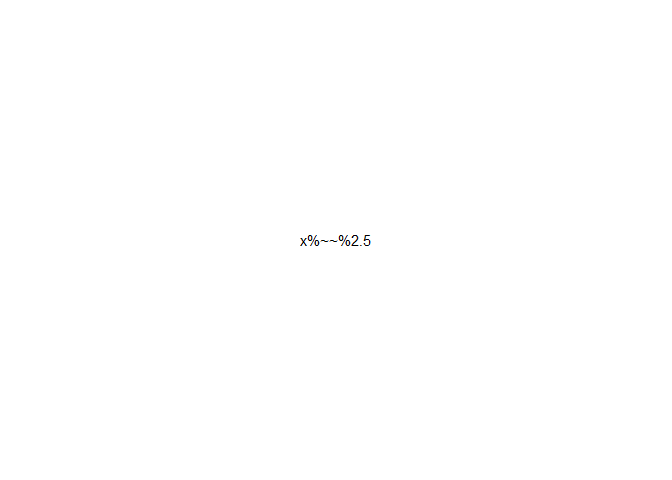
p + annotate("text", x = .5, y=.5,
label = expression(paste("x", "%~~%", "2.5")))
#> Warning in is.na(x): is.na() applied to non-(list or vector) of type
#> 'expression'
This still throws the warning but you do get the desired output, I think.
library(ggplot2)
p <- ggplot() +
  theme_void()

p + annotate("text", x = .5, y=.5,
             label = expression(x %~~% 2.5))
#> Warning in is.na(x): is.na() applied to non-(list or vector) of type
#> 'expression'
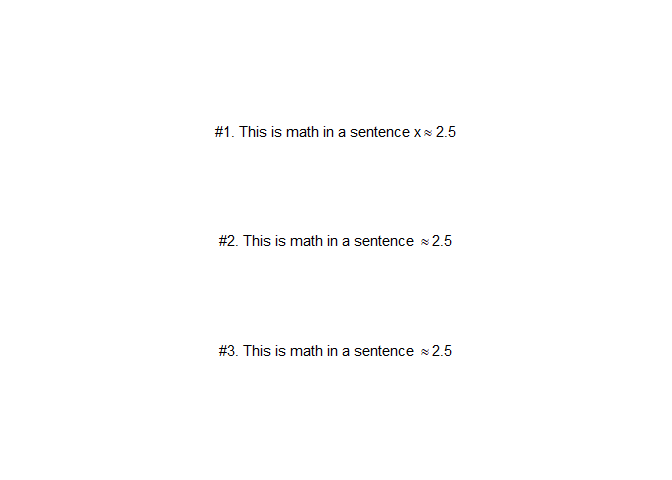
So it seems my issue is that I didn't put anything before the %~~%. (In my plot for my project that is, not in the original post here.) Somehow and for some strange reason, you can put a set of empty quotes ("") before the %~~% and it works! But even better you don't need paste at all!
library(ggplot2)

p <- ggplot() +
  ylim(0,1) +
  theme_void()

# fails,  wont even run in reprex!! This is what i was trying to do
p + annotate("text", x = .5, y=.5,
            label = expression(paste("This is math in a sentence ", %~~% 2.5)))
#--> unexpected SPECIAL error (not actual output)

# works
p <- p + annotate("text", x = .5, y=.75,
             label = expression(paste("#1. This is math in a sentence ", x %~~% 2.5)))

# works??!
p <- p + annotate("text", x = .5, y=.5,
             label = expression(paste("#2. This is math in a sentence ", ""%~~% 2.5)))


# Apparently you dont need paste at all??
# I think this is the best way
p + annotate("text", x = .5, y=.25,
             label = expression("#3. This is math in a sentence " %~~% 2.5))
#> Warning in is.na(x): is.na() applied to non-(list or vector) of type
#> 'expression'

#> Warning in is.na(x): is.na() applied to non-(list or vector) of type
#> 'expression'

#> Warning in is.na(x): is.na() applied to non-(list or vector) of type
#> 'expression'