Hi,
I have a problem plotting a facet_wrap with interactions on the x-axis while also showing geom_signif comparisons between groups of categories.
Below, a subset of the df I'm using:
test_ggsig <- structure(list(sample = structure(c(2L, 2L, 2L, 2L, 2L, 2L, 2L,
2L, 2L, 2L, 2L, 2L, 2L, 2L, 2L, 2L, 2L, 2L, 2L, 2L, 2L, 2L, 2L,
2L, 2L, 2L, 1L, 1L, 1L, 1L, 1L, 1L, 1L, 1L, 1L, 1L, 1L, 1L, 1L,
1L), levels = c("irradiated", "clone4", "clone5", "clone7"), class = "factor"),
    experiment = structure(c(5L, 5L, 5L, 5L, 5L, 5L, 5L, 5L,
    3L, 3L, 3L, 3L, 3L, 3L, 4L, 4L, 4L, 4L, 4L, 4L, 1L, 1L, 1L,
    1L, 1L, 1L, 2L, 2L, 2L, 2L, 2L, 2L, 2L, 2L, 1L, 1L, 1L, 1L,
    1L, 1L), levels = c("prt", "24h", "4w", "8w", "12w"), class = "factor"),
    subsample = c("no", "no", "no", "no", "no", "no", "sub",
    "sub", "no", "no", "no", "no", "no", "no", "no", "no", "no",
    "no", "no", "no", "no", "no", "no", "no", "no", "no", "no",
    "no", "no", "no", "no", "no", "sub", "sub", "no", "no", "no",
    "no", "no", "no"), variant_type = structure(c(1L, 1L, 2L,
    2L, 3L, 3L, 3L, 3L, 1L, 1L, 2L, 2L, 3L, 3L, 1L, 1L, 2L, 2L,
    3L, 3L, 1L, 1L, 2L, 2L, 3L, 3L, 1L, 1L, 2L, 2L, 3L, 3L, 3L,
    3L, 1L, 1L, 2L, 2L, 3L, 3L), levels = c("INDELs", "SNPs",
    "all"), class = "factor"), count = c(316419, 1100118, 1088095,
    5940153, 1404514, 7040271, 3455358, 4345492, 879232, 1198194,
    2431906, 2900201, 3311138, 4098395, 820068, 1110595, 2429471,
    2893233, 3249539, 4003828, 810092, 1086322, 2426061, 2883243,
    3236153, 3969565, 302615, 1199306, 1095493, 7711779, 1398108,
    8911085, 3549258, 4606902, 826262, 1077148, 2425855, 2871357,
    3252117, 3948505), filters = c("QUAL > 0", "none", "QUAL > 0",
    "none", "QUAL > 0", "none", "QUAL > 0", "none", "QUAL > 0",
    "none", "QUAL > 0", "none", "QUAL > 0", "none", "QUAL > 0",
    "none", "QUAL > 0", "none", "QUAL > 0", "none", "QUAL > 0",
    "none", "QUAL > 0", "none", "QUAL > 0", "none", "QUAL > 0",
    "none", "QUAL > 0", "none", "QUAL > 0", "none", "QUAL > 0",
    "none", "QUAL > 0", "none", "QUAL > 0", "none", "QUAL > 0",
    "none")), row.names = c(NA, -40L), class = c("tbl_df", "tbl",
"data.frame"))
This is how I'm plotting the data:
library(dplyr)
library(ggpubr)
library(ggplot2)
library(legendry)
library(ggpattern)

ggplot(test_ggsig |> dplyr::filter(filters == "none"), aes(x=interaction(experiment, subsample, sample), y=count)) +
  geom_col(aes(fill=variant_type), color="black", position="dodge2") + theme_classic2() +
  geom_col_pattern(data=test_ggsig |> dplyr::filter(filters != "none"), aes(interaction(experiment, subsample, sample), count, pattern='stripe'),
                  pattern_angle=30, fill=NA, color="black", pattern_size=.075, position="dodge2",
                  pattern_fill="black", pattern_spacing=.0075, pattern_color="black"
                  ) +
  scale_pattern_manual(name="filters", labels="QUAL > 0", values='stripe') +
  geom_signif(comparisons=list(c("prt.no.irradiated", "24h.sub.irradiated")),
              map_signif_level=TRUE, test="wilcox.test", step_increase=.02, tip_length=.005, size=.4, textsize=4, vjust=.6) +
  geom_signif(comparisons=list(c("prt.no.clone4", "12w.sub.clone4"), c("4w.no.clone4", "12w.sub.clone4"),
                               c("8w.no.clone4", "12w.sub.clone4")),
              map_signif_level=TRUE, test="wilcox.test", step_increase=.02, tip_length=.005, size=.4, textsize=4, vjust=.6) +
  facet_wrap(~sample, strip.position='bottom', nrow=1, scales='free_x') +
  guides(x = legendry::guide_axis_nested(levels_text = list(element_text(angle=30, hjust=.5, face='bold'), element_text(), element_text()),
                                        levels_brackets = list(element_line(linewidth = .375),
                                        element_line(linewidth = .125)),
                                        drop_zero=FALSE),
         fill=guide_legend(title="variant type", byrow = TRUE, title.position='top', title.hjust=.5, position='inside', ncol=3, order=1),
         pattern=guide_legend(title.position='top', title.hjust=.5, position='inside', ncol=1, order=3)
        ) +
  scale_y_continuous(expand=expansion(mult=0, add=c(0,300000))) +
  xlab(NULL) + ylab(NULL)
The issue is that comparisons beyond the first one (irradiated category) are dropped with these warning messages:
Warning messages:
1: Computation failed in `stat_signif()`.
Caused by error in `if (scales$x$map(comp[1]) == data$group[1] || manual) ...`:
! missing value where TRUE/FALSE needed
2: Computation failed in `stat_signif()`.
Caused by error in `if (scales$x$map(comp[1]) == data$group[1] || manual) ...`:
! missing value where TRUE/FALSE needed
producing the following output
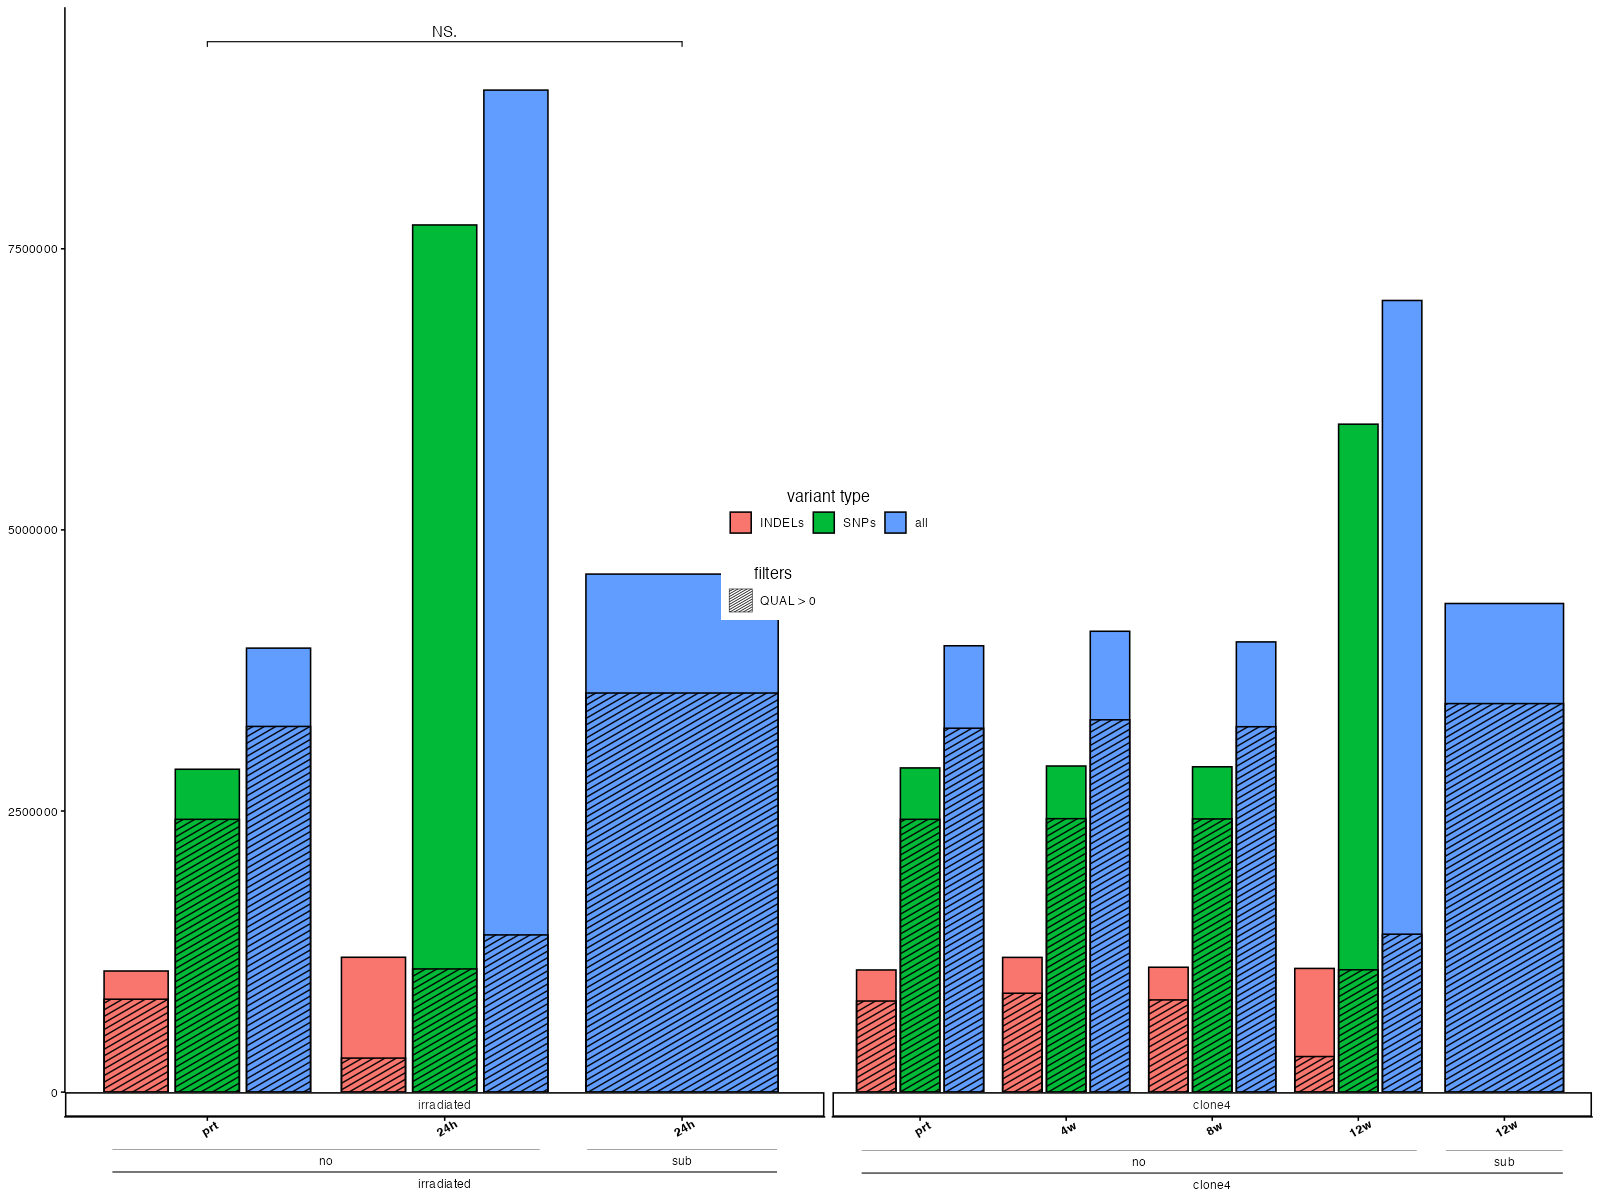
without comparisons across clone4.
I'm unsure what is causing this; however, removing the facet_wrap over samples seems to fix it. Still, I wish to add some extra space and differentiate visually all of them.