Below is a function using tidy evaluation that's intended to work on any data frame to plot singleton groups as points and non-singletons as lines only.
library(tidyverse)

plot_func = function(data, x, y, group.var, sort.singletons=TRUE,
                     shape=16, linetype="solid") {

  # Quote arguments
  x=enquo(x)
  y=enquo(y)
  group.var = enquo(group.var)

  # Mark singleton groups
  data = data %>%
    group_by(!!group.var) %>%
    mutate(single = n()==1) %>%
    ungroup

  # If sort.singletons (the default), place singleton groups after non-singletons in legend
  if(sort.singletons) {
    data = data %>%
      arrange(single, !!group.var) %>%
      mutate(!!group.var := factor(!!group.var, levels=unique(!!group.var)))
  }

  # Generate a named logical vector marking singleton groups
  #  Use this for generating the appropriate legend keys
  single.groups = data %>%
    group_by(!!group.var) %>%
    slice(1) %>%
    select(!!group.var, single) %>%
    deframe()

  # Generate legend key symbols based on single.groups vector we just created
  shapes = single.groups %>% ifelse(., shape, NA_integer_)
  lines = single.groups %>% ifelse(., "blank", linetype)


  data %>%
    ggplot(aes(x = !!x, y = !!y, color = !!group.var)) +
    geom_line(linetype=linetype) +
    geom_point(aes(shape=single)) +
    scale_shape_manual(values=c(`FALSE`=NA, `TRUE`=shape)) +
    guides(shape=FALSE,
           colour=guide_legend(override.aes=list(shape=shapes,
                                                 linetype=lines)))
}
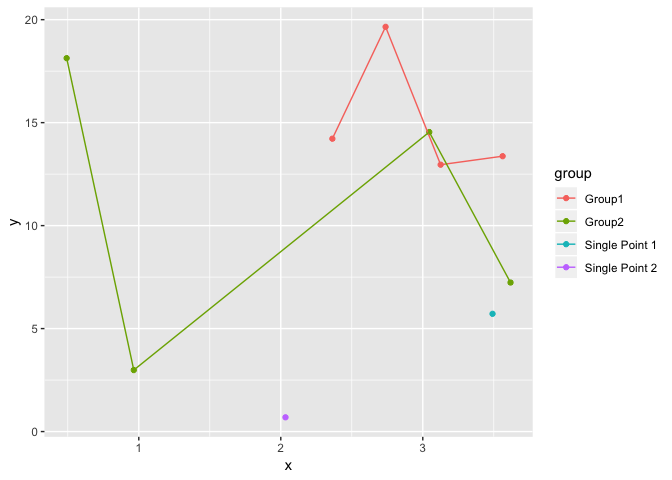
Now, run the function on various data frames:
plot_func(dat, x, y, group)
plot_func(iris, Petal.Width, Petal.Length, Species)

plot_func(iris %>% slice(c(1:50, 51, 101:150)),
          Petal.Width, Petal.Length, Species)
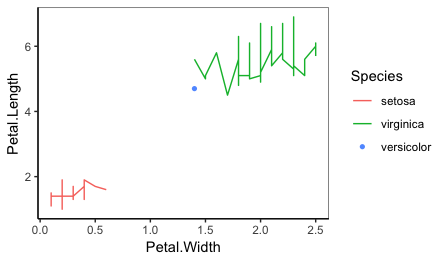
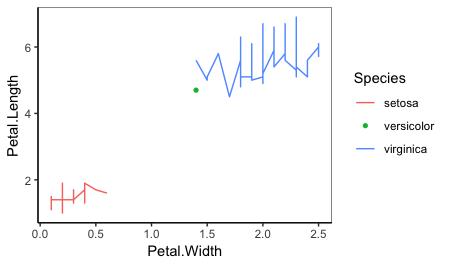
plot_func(iris %>% slice(c(1:50, 51, 101:150)),
          Petal.Width, Petal.Length, Species, sort.singletons=FALSE)
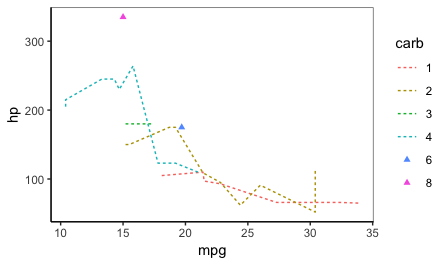
plot_func(mtcars %>% mutate(carb=factor(carb)), mpg, hp, carb,
          shape=17, linetype="22")