Hi all,
Fairly new to R and shiny, but managed to build an app that works really well within the studio. The idea is the user selects a distribution type, number of resamples, and mean and standard error and then a histogram is produced.
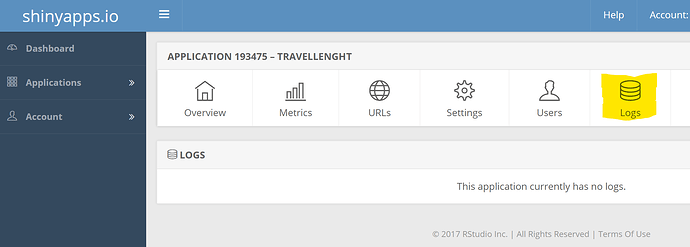
However when I try to upload it to shinyapps.io the upload is successful - but when I try to load that webpage I get "Disconnected from server- Reload"
I've gone though all the diagnostics and can't figure it out ! Any suggestions greatly appreciated !
library(shiny)

ui <- fluidPage(
  pageWithSidebar(
    headerPanel("Distributions Calculator"),

    sidebarPanel(
      selectInput("Distribution", "Please Select Distribution Type",
                  choices = c("Beta", "Gamma", "Lognormal")),
      sliderInput("sampleSize", "Please Number of Samples",
                  min = 100, max = 1000, value = 500, step = 100),
      conditionalPanel(condition = "input.Distribution == 'Beta'",
                       textInput("Meanb", "Please Select the mean", 0.10),
                       textInput("SE", "Please Select Standard Error", 0.05)),
      conditionalPanel(condition = "input.Distribution == 'Gamma'",
                       textInput("Mean", "Please Select the mean", 5),
                       textInput("SD", "Please select the Standard Deviation",1)),
      conditionalPanel(condition = "input.Distribution == 'Lognormal'",
                       textInput("Meanl", "Please Select the mean", 5),
                       textInput("SDl", "Please select the Standard Deviation",1)),

    ),

    mainPanel(tags$label(h3('Distribution of Random Samples')),


      plotOutput("myPlot")
    )
  )

)

server <- function(input, output, session) {

  output$myPlot <- renderPlot({
    distType <- input$Distribution
    size <- input$sampleSize
      if (distType == "Gamma") {
      kappa <- as.numeric(input$Mean)^2 / as.numeric(input$SD)^2
      theta <-  as.numeric(input$SD)^2 / as.numeric(input$Mean)

      randomVec <- rgamma (size, kappa, scale = theta)
      }
    else if(distType == "Beta"){

      a=as.numeric(input$Meanb)
      b=as.numeric(input$SE)

      mm <- as.numeric(a)*(1-as.numeric(a))
      se2 <- as.numeric(b)^2
      ab1 <- as.numeric(mm) / as.numeric(se2)
      alpha <- as.numeric(ab1) * as.numeric(a)
      beta <- as.numeric(ab1) - as.numeric(alpha)

      randomVec <- rbeta(size,alpha , beta)
    }
    else{
      mu <- log(as.numeric(input$Meanl)) - (0.5*(log(((as.numeric(input$SDl)/as.numeric(input$Meanl))^2)+1)))
      sigma <-  sqrt(log(((as.numeric(input$SDl)/as.numeric(input$Meanl))^2)+1))
      randomVec <- rlnorm( size, meanlog= mu, sdlog= sigma)
    }
    hist(randomVec, col = "cyan2", main=NULL)
  })

}

shinyApp(ui = ui, server = server)


