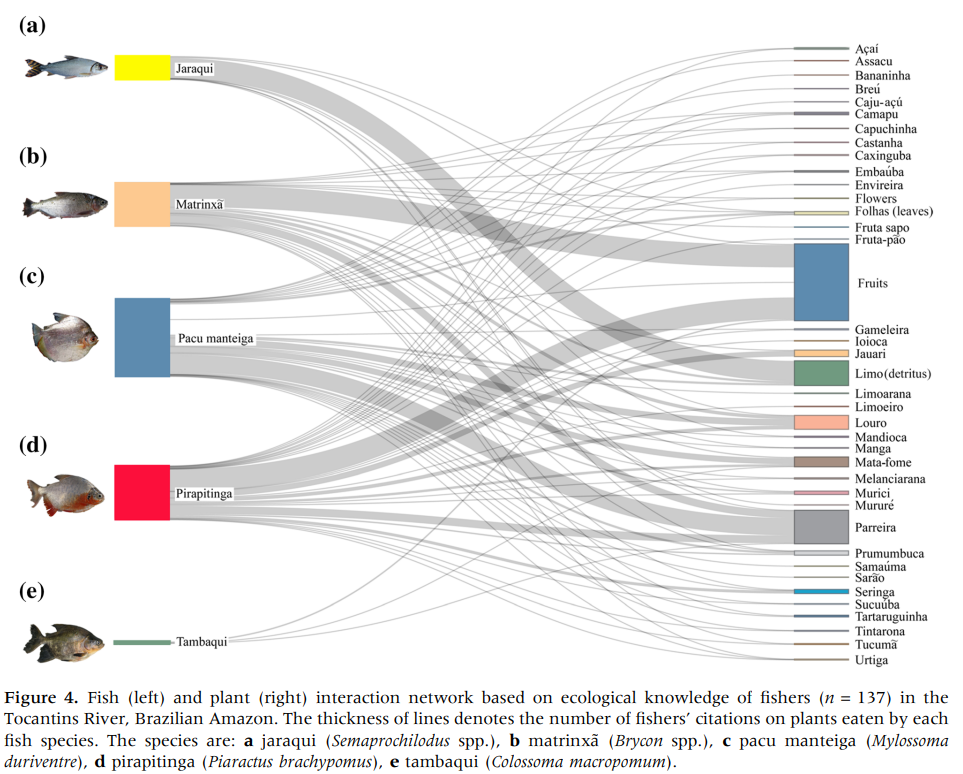
Hi! I'm trying to build a graph like the one from Figure 4 in this paper: " Fishers’ Knowledge Reveals Ecological Interactions Between Fish and Plants in High Diverse Tropical Rivers". I will annex the image in this post.
I'm new at web analysis and don't know certainly how to modify most aspects of the graphs made with plotweb function.
Well, I will try to put in here a reproducible example.
#This code will reproduce some part of my data.
myweb <- data.frame(
fish1 = c(8, 5, 7, 8, 7, 6, 2, 3, 2, 2),
fish2 = c(7, 10, 5, 1, 8, 2, 1, 1, 1, 1),
fish3 = c(1, 8, 2, 1, 4, 0, 1, 1, 2, 1),
fish4 = c(4, 1, 4, 4, 1, 2, 2, 1, 1, 1),
fish5 = c(5, 2, 3, 6, 1, 2, 0, 1, 0, 1))row.names(myweb) <- c("fruit1", "fruit2", "fruit3", "fruit4", "fruit5", "fruit6", "fruit7", "fruit8", "fruit9", "fruit10")
To plot the foodweb I used the following code, but I didn't used most of the arguments:
plotweb(myweb, method = "normal", empty = T, labsize = 1.2, ybig = 1, y.width.low = 0.1, y.width.high = 0.1, high.spacing = NULL, low.spacing = NULL, arrow = "no", col.interaction = "grey80", col.high = "grey10", col.low = "grey10", bor.col.low = "black", bor.col.high = "black", bor.col.interaction = "black", high.lablength = NULL, low.lablength = NULL, text.rot = 90, plot.axes = T, low.y = 0.5, high.y = 1.5, y.lim = c(0.2, 1.8), x.lim = c(0,1.3))
I know my current graph is far from the one in the article, but could someone please help me improve it? I'm particularly struggling with it, and any guidance would be greatly appreciated.
Thank you in advance!
PS: I don't need to put the fish images though, but if you are patient enough to explain how to do it, I will try to learn!!