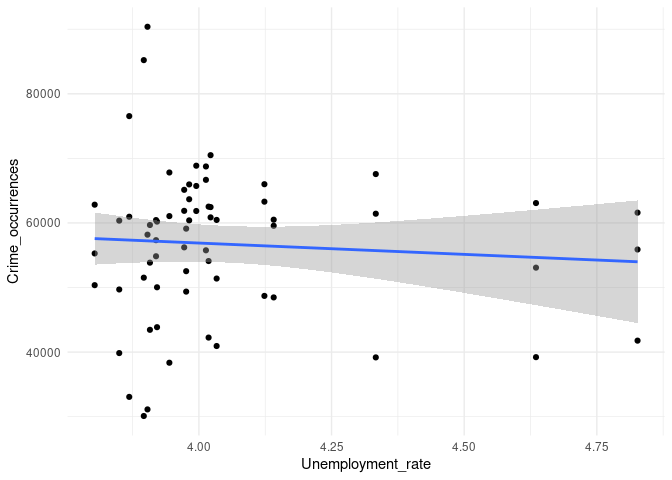
I am not sure if I am interpreting this scatter plot correctly.
It's supposed to help analyse any potential relationship between unemployment rate and crime.
- X axis = crime occurrences (3 types of crime analysed)
- Y axis = unemployment rate
- Plus a geom_smooth() for each crime type
3 questions:
-
Does this graph shows that crimes are more likely to be committed when unemployment rate is lower?
-
Does each dot show how many crimes were committed at every unemployment rate %? I.e. the uppermost red dot shows that over 12k anti-social behaviour crimes were recorded when the unemployment rate was a bit lower than 4.25%?
-
Do the geom_smooth() suggest how each crime type occurrences changed over time OR depending on the unemployment rate?
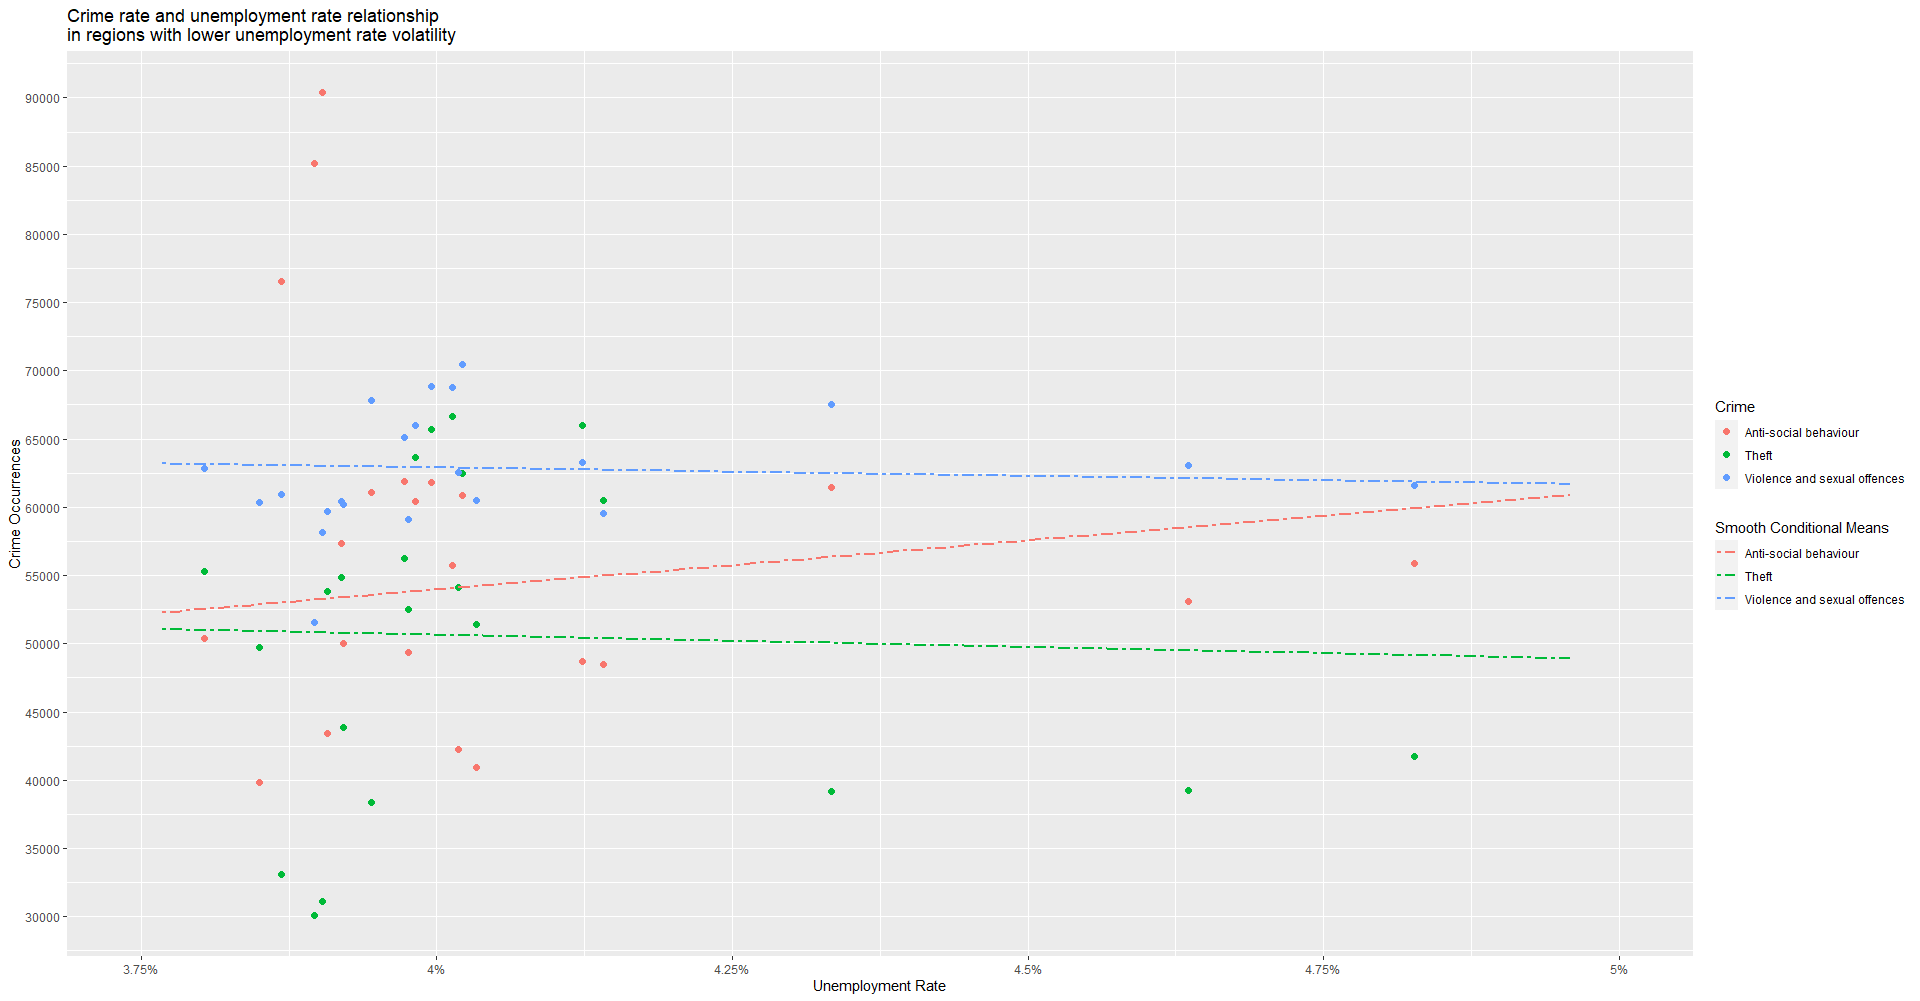
Here's the code I used to plot it:
ggplot() +
  ggtitle("Crime rate and unemployment rate relationship \nin regions with lower unemployment rate volatility") +
  geom_point(aes(x = Unemployment_rate, y= Crime_occurrences, colour = Crime),
             size = 2, data = df) +
  scale_x_continuous(breaks = seq(from = 3.75, to = 5, by = 0.25), #scale X axis
                     limits = c(3.75,5),
                     labels = function(x) paste0(x,"%"))+ #add % symbol to x axis values
  scale_y_continuous(breaks = seq(from = 30000, to = 95000, by = 5000)) +
  xlab("Unemployment Rate") +
  ylab("Crime Occurrences") +
  new_scale_color()+
  labs(linetype = "Crime") +
  geom_smooth(method = 'lm',se=F,
              aes(x=Unemployment_rate,y = Crime_occurrences, group=1,
                  color="Anti-social behaviour"),
              lty = 6, data=smooth_antisocial_L) +
  geom_smooth(method = 'lm',se=F,
              aes(x=Unemployment_rate,y = Crime_occurrences, group=1,
                  color="Theft"),
              lty = 6, data=smooth_theft_L) +
  geom_smooth(method = 'lm',se=F,
              aes(x=Unemployment_rate,y = Crime_occurrences, group=1,
                  color="Violence and sexual offences"),
              lty = 6, data=smooth_violence_L) +
  labs(colour = "Smooth Conditional Means")
Here's the data frame I used to generate this plot:
structure(list(Date = structure(c(17897, 17897, 17897, 17928,
17928, 17928, 17956, 17956, 17956, 17987, 17987, 17987, 18017,
18017, 18017, 18048, 18048, 18048, 18078, 18078, 18078, 18109,
18109, 18109, 18140, 18140, 18140, 18170, 18170, 18170, 18201,
18201, 18201, 18231, 18231, 18231, 18262, 18262, 18262, 18293,
18293, 18293, 18322, 18322, 18322, 18353, 18353, 18353, 18383,
18383, 18383, 18414, 18414, 18414, 18444, 18444, 18444, 18475,
18475, 18475, 18506, 18506, 18506, 18536, 18536, 18536), class = "Date"),
    Crime = c("Anti-social behaviour", "Theft", "Violence and sexual offences",
    "Anti-social behaviour", "Theft", "Violence and sexual offences",
    "Anti-social behaviour", "Theft", "Violence and sexual offences",
    "Anti-social behaviour", "Theft", "Violence and sexual offences",
    "Anti-social behaviour", "Theft", "Violence and sexual offences",
    "Anti-social behaviour", "Theft", "Violence and sexual offences",
    "Anti-social behaviour", "Theft", "Violence and sexual offences",
    "Anti-social behaviour", "Theft", "Violence and sexual offences",
    "Anti-social behaviour", "Theft", "Violence and sexual offences",
    "Anti-social behaviour", "Theft", "Violence and sexual offences",
    "Anti-social behaviour", "Theft", "Violence and sexual offences",
    "Anti-social behaviour", "Theft", "Violence and sexual offences",
    "Anti-social behaviour", "Theft", "Violence and sexual offences",
    "Anti-social behaviour", "Theft", "Violence and sexual offences",
    "Anti-social behaviour", "Theft", "Violence and sexual offences",
    "Anti-social behaviour", "Theft", "Violence and sexual offences",
    "Anti-social behaviour", "Theft", "Violence and sexual offences",
    "Anti-social behaviour", "Theft", "Violence and sexual offences",
    "Anti-social behaviour", "Theft", "Violence and sexual offences",
    "Anti-social behaviour", "Theft", "Violence and sexual offences",
    "Anti-social behaviour", "Theft", "Violence and sexual offences",
    "Anti-social behaviour", "Theft", "Violence and sexual offences"
    ), Crime_occurrences = c(48701L, 65999L, 63295L, 48466L,
    60502L, 59562L, 55761L, 66675L, 68746L, 60397L, 63669L, 65965L,
    61850L, 65725L, 68863L, 60862L, 62455L, 70496L, 61875L, 56217L,
    65130L, 57331L, 54841L, 60444L, 49365L, 52528L, 59115L, 50363L,
    55277L, 62828L, 43449L, 53850L, 59680L, 39847L, 49695L, 60358L,
    42248L, 54099L, 62524L, 40940L, 51389L, 60469L, 50036L, 43857L,
    60206L, 85213L, 30102L, 51524L, 90380L, 31124L, 58183L, 76542L,
    33063L, 60959L, 61060L, 38352L, 67812L, 61428L, 39178L, 67569L,
    53077L, 39215L, 63079L, 55887L, 41773L, 61591L), Unemployment_rate = c(4.12344811627314,
    4.12344811627314, 4.12344811627314, 4.14095110134931, 4.14095110134931,
    4.14095110134931, 4.01323345624432, 4.01323345624432, 4.01323345624432,
    3.98165688212034, 3.98165688212034, 3.98165688212034, 3.9949985797279,
    3.9949985797279, 3.9949985797279, 4.02198311038492, 4.02198311038492,
    4.02198311038492, 3.97224528388891, 3.97224528388891, 3.97224528388891,
    3.9191851565279, 3.9191851565279, 3.9191851565279, 3.97596949462614,
    3.97596949462614, 3.97596949462614, 3.80352996332542, 3.80352996332542,
    3.80352996332542, 3.90768007484014, 3.90768007484014, 3.90768007484014,
    3.84982022142404, 3.84982022142404, 3.84982022142404, 4.0182521800768,
    4.0182521800768, 4.0182521800768, 4.0334041605285, 4.0334041605285,
    4.0334041605285, 3.92106608927081, 3.92106608927081, 3.92106608927081,
    3.89612131845226, 3.89612131845226, 3.89612131845226, 3.90307987656759,
    3.90307987656759, 3.90307987656759, 3.86867718232534, 3.86867718232534,
    3.86867718232534, 3.94431710971825, 3.94431710971825, 3.94431710971825,
    4.33339138157948, 4.33339138157948, 4.33339138157948, 4.63534527853297,
    4.63534527853297, 4.63534527853297, 4.82676294010233, 4.82676294010233,
    4.82676294010233)), row.names = c(NA, -66L), class = "data.frame")
And here's one of the geom_smooth() dput to give you an idea:
structure(list(Date = structure(c(17897, 17928, 17956, 17987,
18017, 18048, 18078, 18109, 18140, 18170, 18201, 18231, 18262,
18293, 18322, 18353, 18383, 18414, 18444, 18475, 18506, 18536,
17897, 17928, 17956, 17987, 18017, 18048, 18078, 18109, 18140,
18170, 18201, 18231, 18262, 18293, 18322, 18353, 18383, 18414,
18444, 18475, 18506, 18536, 17897, 17928, 17956, 17987, 18017,
18048, 18078, 18109, 18140, 18170, 18201, 18231, 18262, 18293,
18322, 18353, 18383, 18414, 18444, 18475, 18506, 18536, 17897,
17928, 17956, 17987, 18017, 18048, 18078, 18109, 18140, 18170,
18201, 18231, 18262, 18293, 18322, 18353, 18383, 18414, 18444,
18475, 18506, 18536), class = "Date"), Crime = c("Anti-social behaviour",
"Anti-social behaviour", "Anti-social behaviour", "Anti-social behaviour",
"Anti-social behaviour", "Anti-social behaviour", "Anti-social behaviour",
"Anti-social behaviour", "Anti-social behaviour", "Anti-social behaviour",
"Anti-social behaviour", "Anti-social behaviour", "Anti-social behaviour",
"Anti-social behaviour", "Anti-social behaviour", "Anti-social behaviour",
"Anti-social behaviour", "Anti-social behaviour", "Anti-social behaviour",
"Anti-social behaviour", "Anti-social behaviour", "Anti-social behaviour",
"Anti-social behaviour", "Anti-social behaviour", "Anti-social behaviour",
"Anti-social behaviour", "Anti-social behaviour", "Anti-social behaviour",
"Anti-social behaviour", "Anti-social behaviour", "Anti-social behaviour",
"Anti-social behaviour", "Anti-social behaviour", "Anti-social behaviour",
"Anti-social behaviour", "Anti-social behaviour", "Anti-social behaviour",
"Anti-social behaviour", "Anti-social behaviour", "Anti-social behaviour",
"Anti-social behaviour", "Anti-social behaviour", "Anti-social behaviour",
"Anti-social behaviour", "Anti-social behaviour", "Anti-social behaviour",
"Anti-social behaviour", "Anti-social behaviour", "Anti-social behaviour",
"Anti-social behaviour", "Anti-social behaviour", "Anti-social behaviour",
"Anti-social behaviour", "Anti-social behaviour", "Anti-social behaviour",
"Anti-social behaviour", "Anti-social behaviour", "Anti-social behaviour",
"Anti-social behaviour", "Anti-social behaviour", "Anti-social behaviour",
"Anti-social behaviour", "Anti-social behaviour", "Anti-social behaviour",
"Anti-social behaviour", "Anti-social behaviour", "Anti-social behaviour",
"Anti-social behaviour", "Anti-social behaviour", "Anti-social behaviour",
"Anti-social behaviour", "Anti-social behaviour", "Anti-social behaviour",
"Anti-social behaviour", "Anti-social behaviour", "Anti-social behaviour",
"Anti-social behaviour", "Anti-social behaviour", "Anti-social behaviour",
"Anti-social behaviour", "Anti-social behaviour", "Anti-social behaviour",
"Anti-social behaviour", "Anti-social behaviour", "Anti-social behaviour",
"Anti-social behaviour", "Anti-social behaviour", "Anti-social behaviour"
), Crime_occurrences = c(48701L, 48466L, 55761L, 60397L, 61850L,
60862L, 61875L, 57331L, 49365L, 50363L, 43449L, 39847L, 42248L,
40940L, 50036L, 85213L, 90380L, 76542L, 61060L, 61428L, 53077L,
55887L, 48701L, 48466L, 55761L, 60397L, 61850L, 60862L, 61875L,
57331L, 49365L, 50363L, 43449L, 39847L, 42248L, 40940L, 50036L,
85213L, 90380L, 76542L, 61060L, 61428L, 53077L, 55887L, 48701L,
48466L, 55761L, 60397L, 61850L, 60862L, 61875L, 57331L, 49365L,
50363L, 43449L, 39847L, 42248L, 40940L, 50036L, 85213L, 90380L,
76542L, 61060L, 61428L, 53077L, 55887L, 48701L, 48466L, 55761L,
60397L, 61850L, 60862L, 61875L, 57331L, 49365L, 50363L, 43449L,
39847L, 42248L, 40940L, 50036L, 85213L, 90380L, 76542L, 61060L,
61428L, 53077L, 55887L), Unemployment_rate = c(3.13281377800783,
4.68247349426148, 5.0708122696351, 3.60769292318816, 3.259676887651,
4.24086209425895, 5.20425572086481, 3.85900970262247, 3.18049050596868,
4.02517515965457, 5.07463979478007, 3.77262836457398, 3.00553644073387,
4.29397104451947, 4.95863831882363, 3.66848172440438, 2.81131839449418,
4.23454968410189, 4.79139912788739, 4.14272711242814, 2.90440048952152,
4.28118824655063, 4.56621383409869, 4.33612987136883, 2.79802032127443,
4.63665149464923, 4.15610221124255, 4.29820710838942, 3.08966319084375,
4.50379542173275, 3.98279027057451, 4.10049174296061, 3.15150059517075,
4.46358064141772, 4.09111105457073, 4.19768568734536, 3.09433421567558,
3.65653388653173, 4.4653881330391, 3.99786361805527, 3.27106119142821,
3.86911315140672, 4.31748261760943, 4.1730633389162, 3.13332712805949,
3.58533538113168, 4.43826006085208, 4.2423583156529, 3.22884092778213,
3.93320874039025, 4.50210360585639, 4.40885544627843, 2.99681254988402,
4.02503140646339, 4.81764323428107, 4.29412945148553, 2.90903701310954,
3.76788548732822, 5.02382063022771, 3.98352122641776, 3.01997997605704,
3.67161258712684, 4.80322174913054, 4.08967096149463, 2.99042563020473,
3.97182605242641, 4.85515814694348, 3.79490967669574, 3.25568537435778,
4.3194319371037, 4.41226516242903, 3.48732625541084, 3.50626064652609,
4.38753537321373, 4.37107017836121, 3.51240224077197, 4.06197213710062,
4.39271393019063, 4.62628095567074, 4.25259850335592, 4.131002249127,
4.89588411607636, 4.9378241924801, 4.57667055644844, 3.86912441545878,
5.32040137455687, 5.402969264185, 4.71455670620866)), class = "data.frame", row.names = c(NA,
-88L))
Thanks in advance for any help you can give!