karane
1
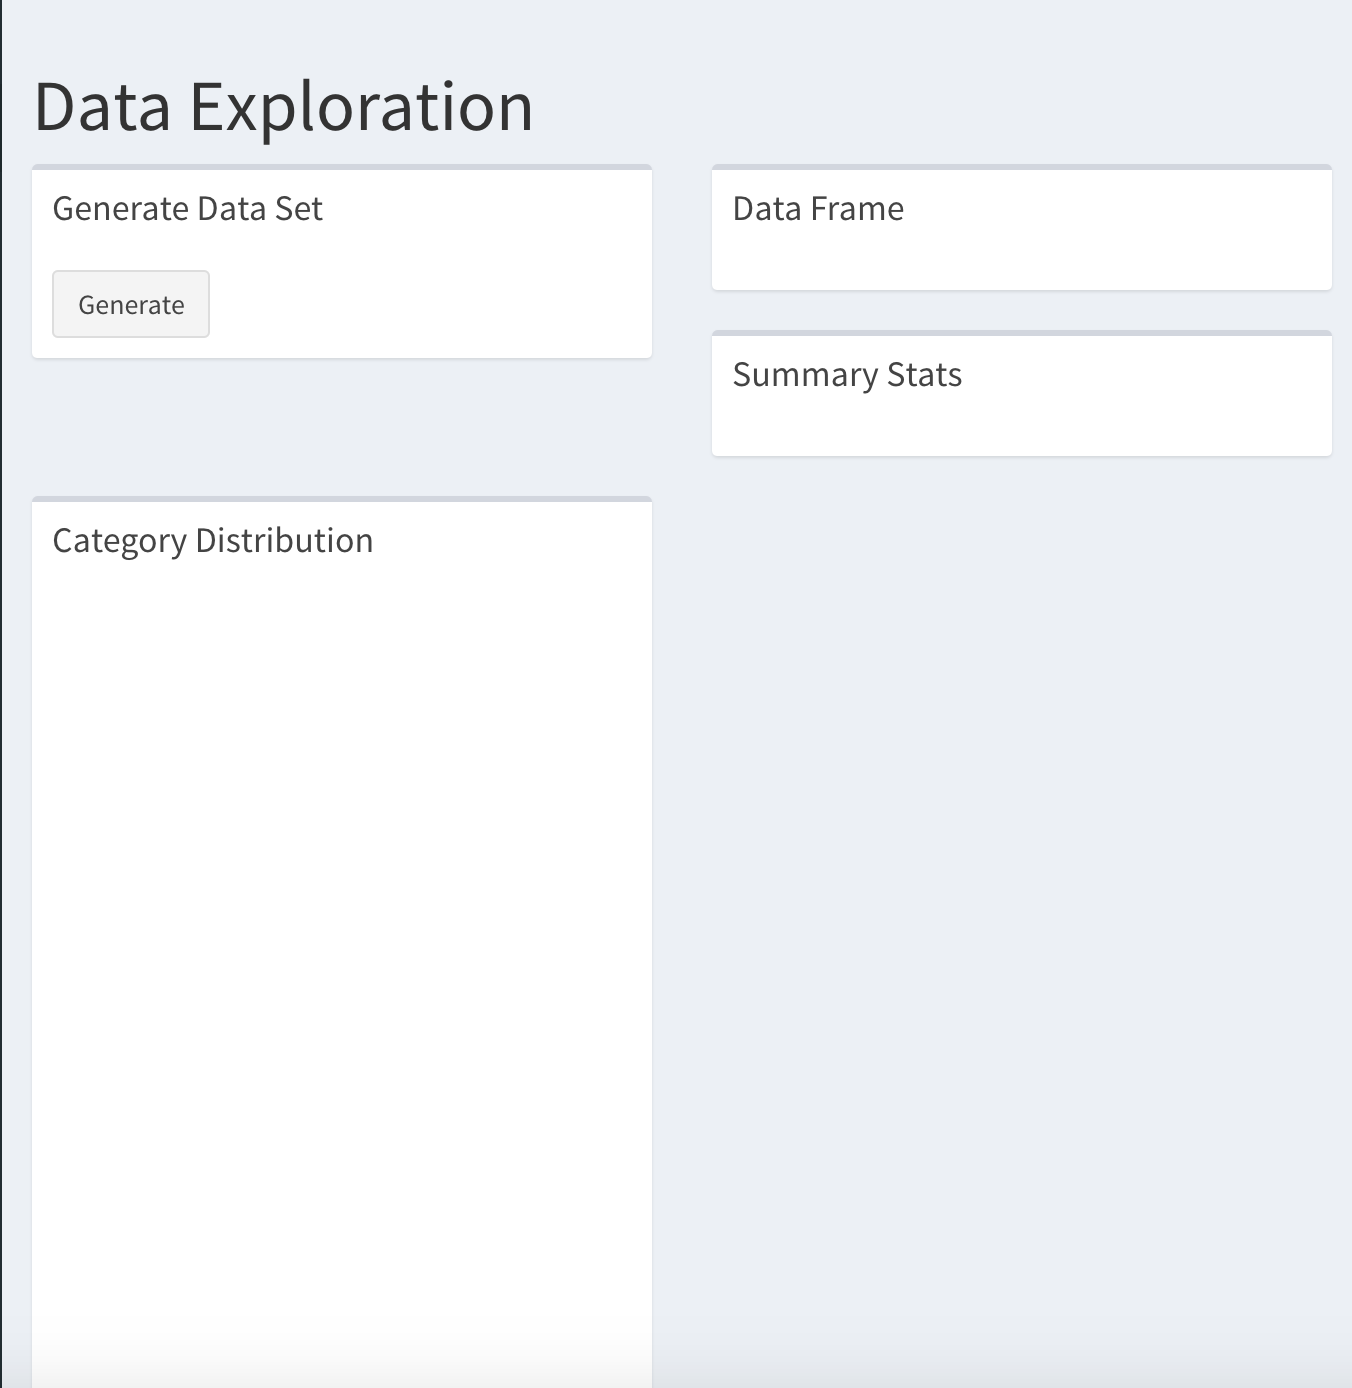
I am trying to align the boxes in shiny dashboard fluid row. I would like the category distribution box to be aligned underneath summary stats.
tabItem(h1("Data Exploration"), tabName = "dataexploration",
        fluidRow(
          box(title = "Generate Data Set", actionButton("data_generate", "Generate")),
          box(title = "Data Frame", dataTableOutput('df')),
          box(title = "Summary Stats", tableOutput('token_summary')),
          box(title = "Category Distribution", plotOutput('category_dist'))
        ))
You could put them into column calls:
tabItem(h1("Data Exploration"), tabName = "dataexploration",
        fluidRow(
          column(
            width = 6,
            box(title = "Generate Data Set", actionButton("data_generate", "Generate")),
            box(title = "Category Distribution", plotOutput('category_dist'))
          ),
          column(
            width = 6,
            box(title = "Data Frame", dataTableOutput('df')),
            box(title = "Summary Stats", tableOutput('token_summary')),
          )
        ))
system
Closed
3
This topic was automatically closed 54 days after the last reply. New replies are no longer allowed.