Agrispectra.farm
Authors: Leonardo Cerliani, Titta Kotilainen, Matthew Robson, Pedro Aphalo
Abstract: Farmers need precise information about the sunlight reaching their plants. With this app, they can easily compare the light plants receive in different greenhouses and tunnels at any location, to select materials optimal for their environment.
Use the app on shinyapps.io.
Full Description:
Utility
The quality of produce from farmers growing plants in greenhouses and polytunnels depends not only on the amount of sunlight available to the plants, but also on its composition in terms of ultraviolet, blue, red and green spectral regions. The specific “light recipe” which maximises the yield, the flavour, and the nutritional value of crops varies across different plant species and geographical locations.
Many different greenhouse climate screens and nets are used to help regulate the growing environment. These materials sometimes intentionally, or often as a side-effect, modify the amount and spectrum of sunlight, manipulating their parts that plants use for photosynthesis and to stimulate specific functions. However, the properties of greenhouse screens are often difficult to retrieve and interpret.
With this app we provide farmers and growers with a tool to estimate the properties of light and compare different materials sold as greenhouse climate screens and insect nets or as filters . The values provided by the app are based on the spectral characteristics of these materials measured year-long by researchers in Helsinki, and then modelled as a function of the sunlight received at any given locations. These sunlight values are calculated based on solar elevation angle, ozone column depth (O3), precipitable water (H2O) and aerosol optical density (AOD), to generate a prediction for each location and period of the year.
The interface is designed to hide the underlying complexity, and instead be intuitive and produce a visual estimate of the properties of different screen materials. Currently, 80+ screen materials are listed and can be selected from dropdown menus, table, plot captions.
In addition, the app also provides an estimate of the Daily Light Integral (DLI) based on historical satellite data. The DLI is popular among farmers and growers as mostly widely understood way to estimate the time-to-yield for different varieties of crop.
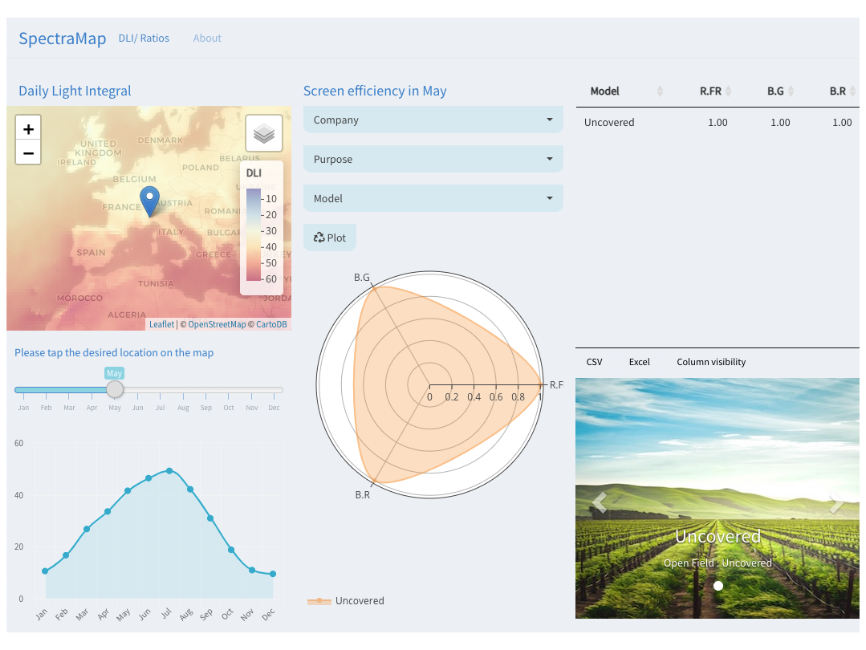
Usage
The interface is designed to encourage the user to interact, moving from left to right (or top to bottom on mobile devices). The user first points to the desired geographical location and month of the year. This will immediately inform them about the distance to the closest NASA station (NASA Aura and NASA Aeronet AOD 2.0) providing the historical measurements of O3, H2O and AOD. In the illustrated example below for instance, by clicking/tapping close to Helsinki, we see that the source of data is 257 Km away in Tõravere (Estonia).
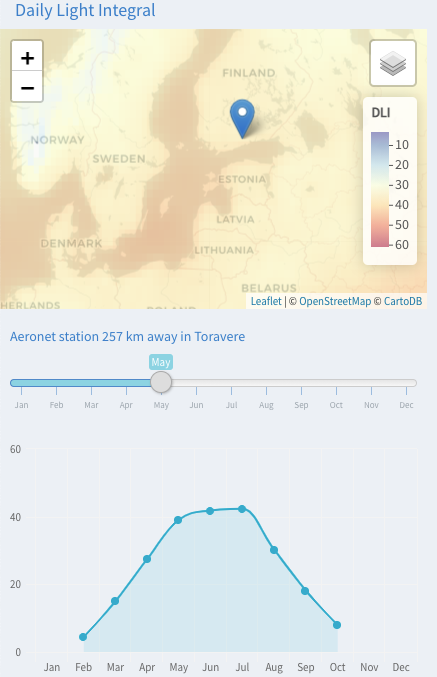
In addition, the user also obtains an estimate of the DLI for the same period according to the historical data from the Clara 2.0 satellite surface incoming shortwave radiation data (200-4000 nm).
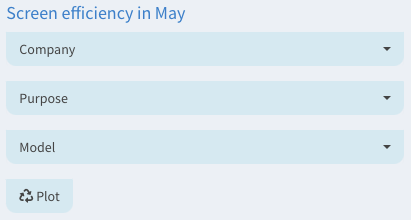
At this point, the user can make their initial selection of screening materials, by choosing the manufacturer/company, the purpose (e.g. shade screen or net), and the specific product (s).
Currently, there are 80+ materials listed. The aim of this interface is to enable the farmer to carry out an initial selection which can subsequently be refined.
After clicking “Plot”, the central visualization appears, where an estimate of the efficiency of the selected screens in different spectral regions of sunlight is visualized. Additionally, the spectral ratios (see Technical Details below) of unfiltered sunlight (“Uncovered”) are also shown for comparison.
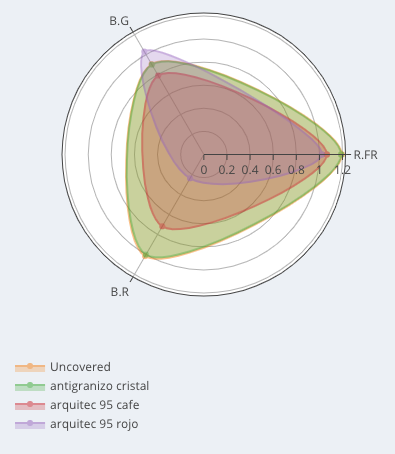
In this example, we see that there is a large difference in the ratio between blue and red (B.R) among the selected materials.
The whole plot or the ruler can also be rotated to obtain a more quantitative estimate of these differences.
The selection can be refined in the caption by clicking once on each material (to remove/add) or double-click on a specific material to visualize only that one.
The estimates of these light frequency ratios are also reported in the table on the left. To further refine the selection of materials which are plotted, the user can then click on the interesting rows on the table.
Finally, an image of the materials chosen in the table are shown in the carousel - for those materials for which one is available.
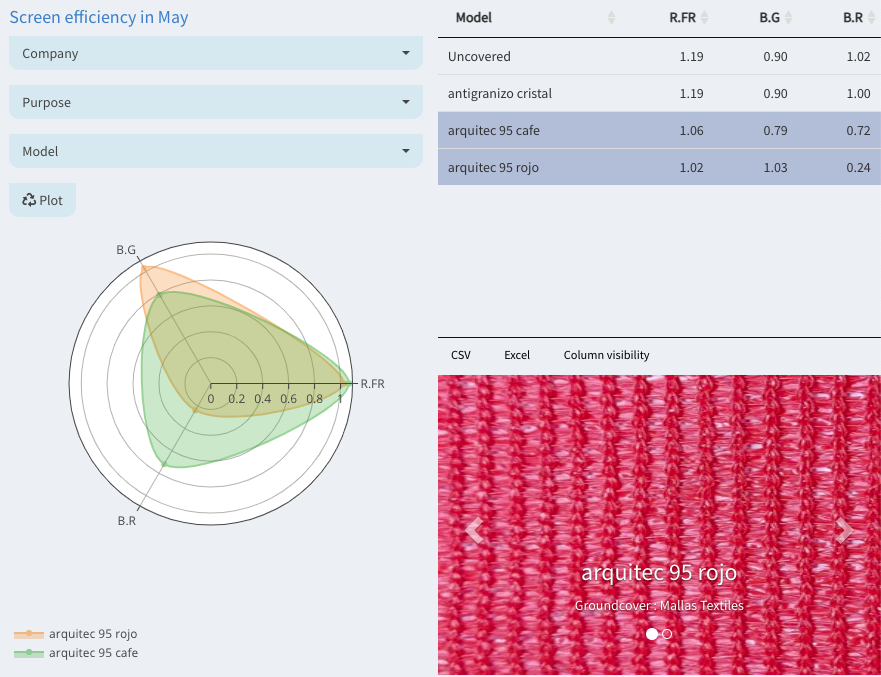
In summary, to navigate across the wide selection of materials, the user first makes a broad selection, either to check the products from specific manufacturers or to find materials that match their intended usage.
This initial selection can be refined either based on the visual comparison in the plot, or based on the quantitative estimates in the table. The user can go back and forth between the table and the plot, or even visualize the chosen materials in the carousel.
Technical details
The sum of solar irradiance, expressed as the daily light integral (DLI), varies across geographical locations and with time of the year.
Greenhouse and tunnel covering materials developed for a range of purposes modify the spectral ratios received by plants.
Knowledge of light conditions under these materials will allow farmers and growers to choose those that improve plant growth, crop yield and food quality and nutrition, through manipulation of the spectral quality of sunlight.
To make information on DLI and light quality readily accessible to growers, we have designed an easy-to-use app. The app provides information on: (1) Solar DLI as a global map for a selected month and a monthly time series of DLI; (2) The effect on photon ratios of sunlight transmitted by +80 types of screen.
DLI is calculated from the Clara 2.0 satellite surface incoming shortwave radiation data (200-4000 nm), available through EUMETSAT CM SAF Climate Monitoring. The user obtains monthly DLIs at a desired location averaged over the period of 2005-2015.
The effect of the covering material is calculated at <1 nm resolution and displayed as biologically meaningful spectral photon ratios of red to far-red (R:FR), blue to green (B:G) and blue to red (B:R). For this, monthly data is estimated using a linear model based on the historical data (last 10-20 years) of the total ozone column (TOC) depth (NASA Aura), precipitable water vapour and aerosol optical density (NASA Aeronet AOD 2.0).
Using dropdown-menus for “Manufacturer” and “Filter Type”, the user can select the best material for their desired purpose (e.g. climate screen or shade net). The app provides calculated spectral ratios of sunlight transmitted under the selected materials, and plots this information for easy visual comparison, together with an image of each material.
Spectal photon ratios are calculated as follows: blue:green (B:G) 420–490 nm/500-570 nm, blue:red (B:R) 420–490 nm/620-680 nm, red:far-red (R:FR) 655–665 nm/725–735 nm. B:G and B:R are according to Sellaro et al. (2010) and R:FR according to Smith (1982). In terms of plant function, low R:FR is an indicator or shade and triggers the contingent plant functions, blue and red are important for photosynthesis, and blue light and UV radiation stimulate desirable antioxidants that increase food quality and herbivore resistance
Sellaro R., Crepy M., Trupkin S.A., Karayekov E., Buchovsky A.S., Rossi,C., Casal J.J. (2010) Cryptochrome as a sensor of the blue/green ratio of natural radiation in Arabidopsis. Plant Physiol. 154, 401–9. https://doi.org/10.1104/pp.110.160820
Smith H. (1982) Light quality, photoperception and plant strategy. Annu. Rev. Plant Physiol. 33, 481–518.
DLI is calculated from the surface incoming shortwave radiation data according to Faust & Logan (2018).
Faust J.E. & Logan J. (2018) Daily light integral: A research review and high-resolution maps of the Unites States. HortScience 53, 1250-1257.
For detailed description about the materials and the complete data set of those measurements: https://zenodo.org/record/1472634#.XfE3MZMzapq
Affiliations
Leonardo Cerliani, Netherlands Institute for Neuroscience, University of Amsterdam, the Netherlands
Titta Kotilainen, Natural Resources Institute Finland - LUKE, Turku, Finland
Matthew Robson, Pedro Aphalo, Organismal and Evolutionary Biology (OEB), Viikki Plant Science Centre (ViPS), Faculty of Biological and Environmental Sciences, University of Helsinki, Finland
Made with R/Shiny
Copyright 2019, Leonardo Cerliani, Titta Kotilainen, Matthew Robson
Keywords: Agriculture, Greenhouses, Solar Irradiance, Visualization, DT, Plotly, dplyr
Shiny app: https://agronomous.shinyapps.io/spectramap/
Repo: GitHub - leonardocerliani/spectramap: Shiny App to display the spectrum of light received by plants covered with greenhouse materials
RStudio Cloud: Posit Cloud
Thumbnail:
Full image: