After Networking Data - How do I see a table that shows me some kind of Network ID

Hi,

I have a large dataset of adjacencies. By this I mean data like:-

links=data.frame(
source=c("K", "A","A", "A", "A", "A","J", "B", "B", "C", "C", "D","I" ,"K", "A", "A"),
target= c("P", "B","B", "C", "D", "J", "A","E", "F", "G", "H", "I","I" , "L", "G", "C")

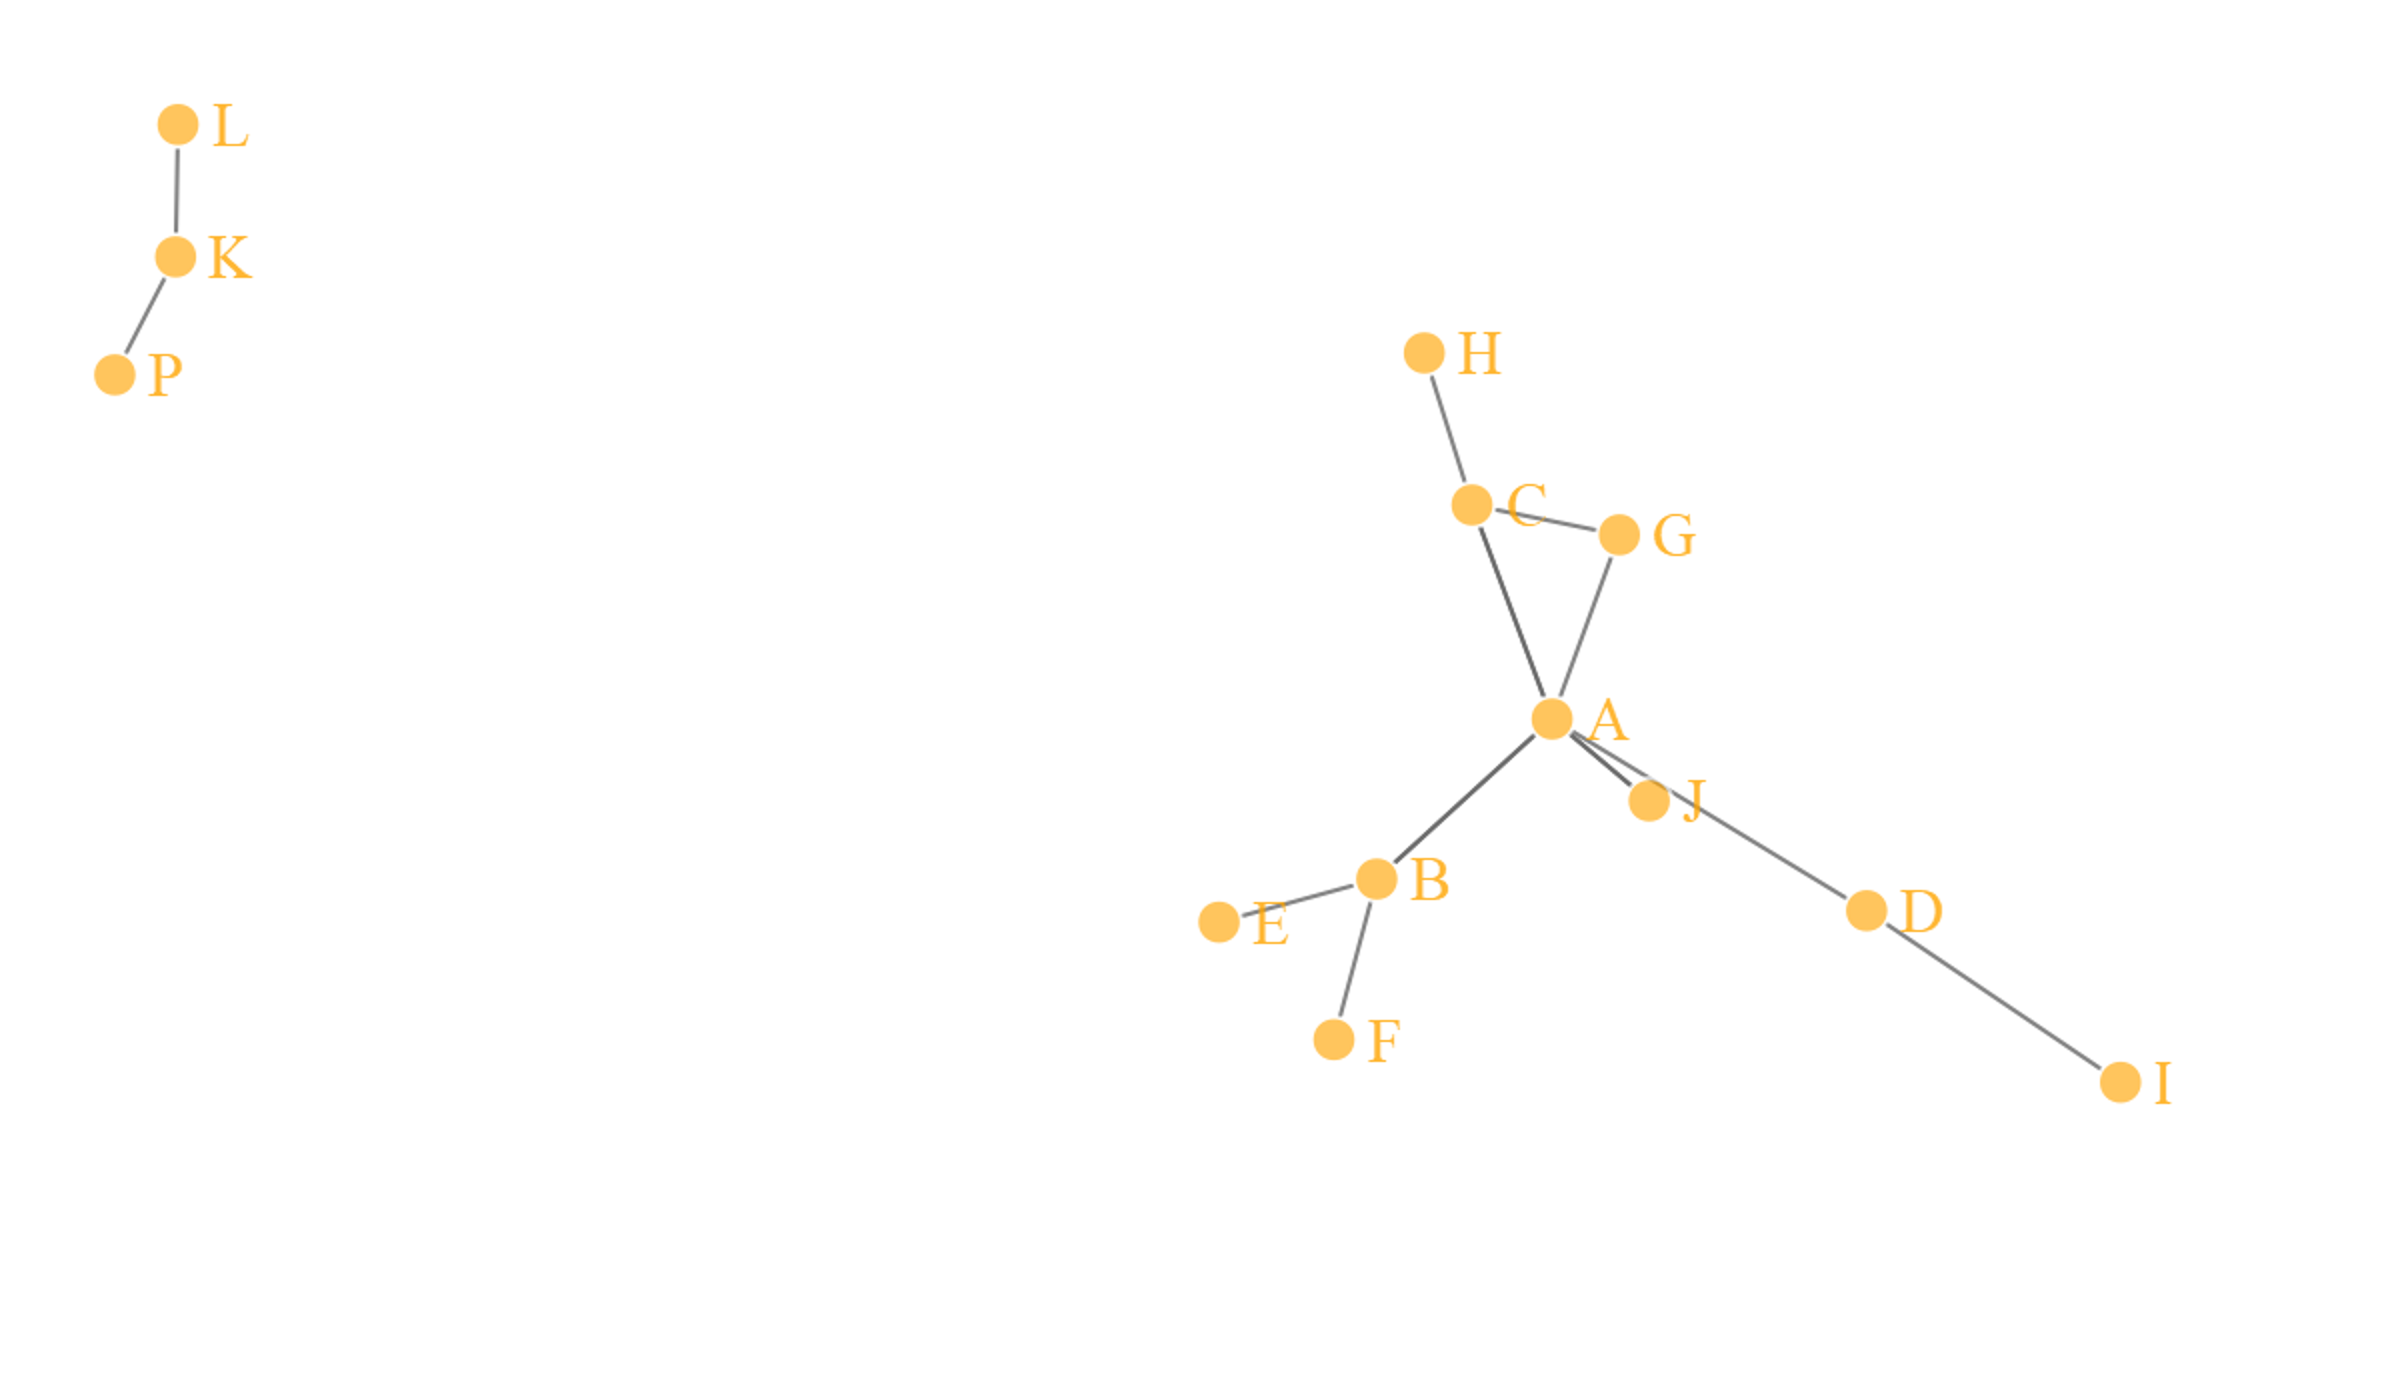
In reality my data has tens of thousands of adjacencies and when networked it will create many distinct/separate networks of various sizes. The example data above creates two distinct networks - my data will have hundreds of distinct non-linking networks.

Just picking a basic network function ('simpleNetwork') on the above data gives the following visualisation.

So on this simple data, I'm after an output dataset that has a network ID - like the mocked-up table below. I'm less interested in the visualisation.

Network ID source target
1 L K
1 K P
2 H C
2 C G
2 C A
etc

This table shows me which adjacencies are in which network and will allow me to build network level metrics such as network size etc and overlay some other data I have - and then I can select certain ones of interest to visualise.

Is there an R function/package that will get me this kind of table?

regards,

Andy

Hi,

The iGraph package seems to be the one you want containing loads of functions for graph analysis. I wasn't familiar with it, but after some digging found a function that will do the trick. Here's my code:

library("networkD3")
library("igraph")
library("dplyr")

#Dataset
links=data.frame(
  source=c("K", "A","A", "A", "A", "A","J", "B", "B", "C", "C", "D","I" ,"K", "A", "A"),
  target= c("P", "B","B", "C", "D", "J", "A","E", "F", "G", "H", "I","I" , "L", "G", "C"), stringsAsFactors = F)

#Create and save graph
myGraph = simpleNetwork(links)
myGraph

#Create an iGraph with same data
iGraph = graph_from_edgelist(as.matrix(links))

#Find the groups (disjoint graphs)
groups = components(iGraph)$`membership`

#Add groups to original dataset (dplyr implementation)
links = links %>% mutate(group = groups[source])

#Add groups to original dataset  (regular R implementation)
links$group = groups[links$source]

And this is the resulting table:

   source target group
1       K      P     1
2       A      B     2
3       A      B     2
4       A      C     2
5       A      D     2
6       A      J     2
7       J      A     2
8       B      E     2
9       B      F     2
10      C      G     2
11      C      H     2
12      D      I     2
13      I      I     2
14      K      L     1
15      A      G     2
16      A      C     2

It seems if you want to go more complex you can use the forceNetwork function and colour the nodes according to the group etc.

Hope this helps!
PJ

1 Like

Thank you so much !

I've started looking at the the i Graph package - it is incredibly detailed -so much to learn

Thank you for taking the time and answering my question

Andy

1 Like

This topic was automatically closed 7 days after the last reply. New replies are no longer allowed.