Background
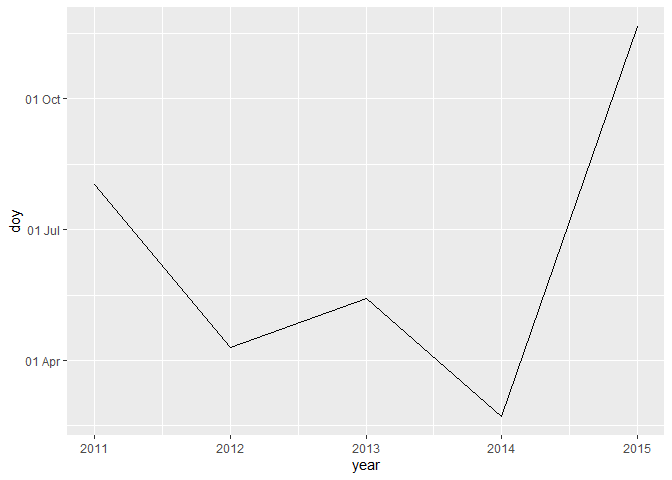
I often work with and support people working with daily climatic time series data. The day of the year (number from 1 to 365/366) is a useful variable. I often calculate a yearly summary such as day of the year of a first occurrence of some event. I then want to plot a simple time series of this "day of the year". It's much nicer to display this as e.g. "1 Feb" for 32 so the meaning is clear. For graphs, I convert the day of year to a date with an arbitrary year and then just display the day and month on the axis, as shown below.
library(ggplot2)
df <- data.frame(year = 2011:2015, doy = c(215, 101, 135, 53, 325))

ggplot(df, aes(x = year, y = as.Date(doy, origin = "2015-12-31"))) +
  geom_line() +
  scale_y_date(date_labels="%d %b") +
  labs(y = "doy")

From searching around this seems the easiest solution. But it gets a bit repetitive, and is off putting to new users of R I work with.
Plus, it would also be nice if this could display as "1 Feb" when printing, and in data frames etc, not just graphs.
I've not found any data structure/type set up for this. So I'm thinking that it could be useful to make a "day of the year" data structure which is internally just a number, but can display in other ways. I think what I want is something similar to how difftime works. So, I'm wanting to create something that would work like:
as.doy(c(32, 33))
#> [1]   "1-Feb" "2-Feb"
I have experience in R but not at this kind of programming with R. So I'm not really sure where to start on this. I'm assuming its feasible to do.
Is there any documentation or packages that have done similar things that I could learn from?
And, if I had my own data type, could I create my own scale_ functions which ggplot2 would recognise so that it could by default display as I like on an axis?
Any help or guidance would be very appreciated, thanks.