Hello,
I need to do some adjustments and change the scientific numbers on the axis to the general number but when I use axis command both of them overlap and the label cannot be read (half of it is outside the window)! also, I want to compress the legend and reduce its margins but I could not find the solution for it. Can you help me how to fix it?
Thanks
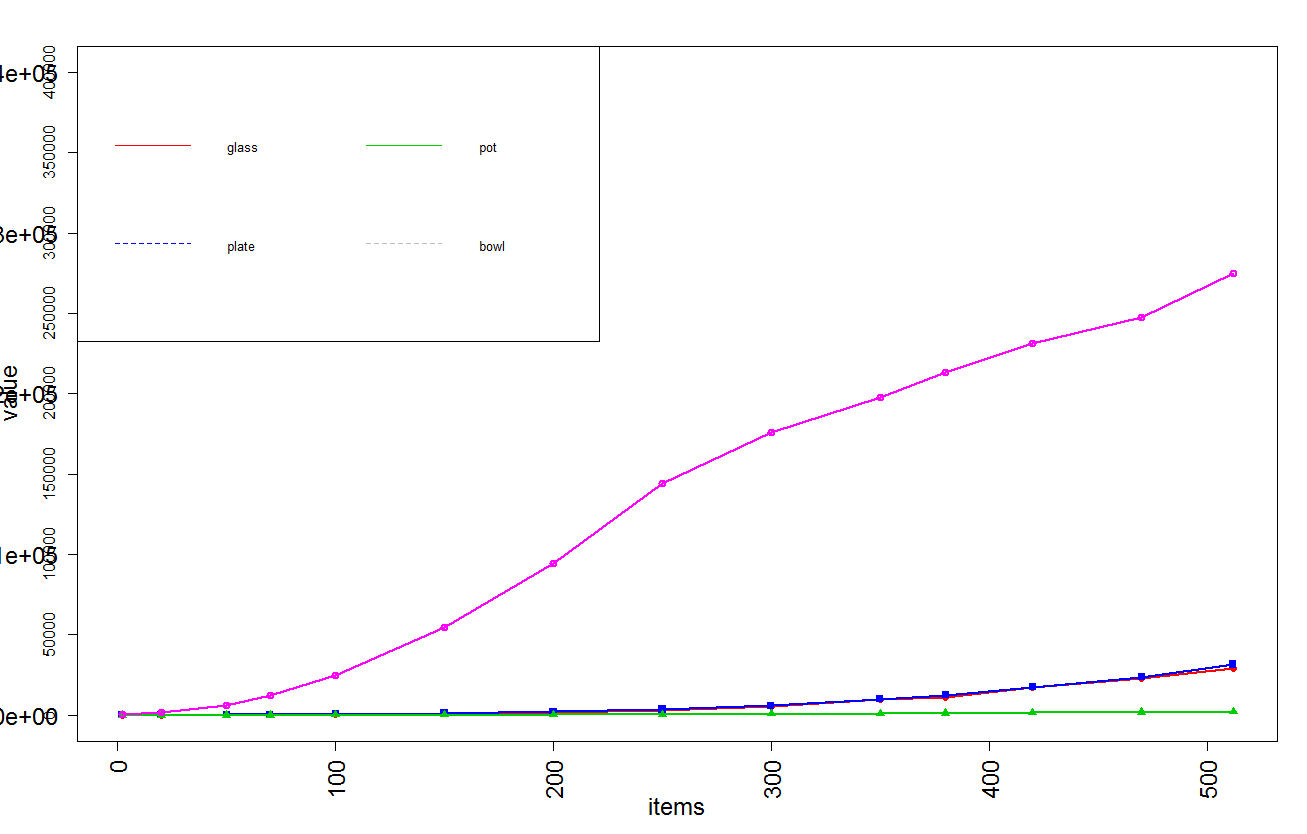
my.limits = as.numeric(seq(0, 400000, by = 50000))

plot(file1$No. , file1$glass,col = "red",type="o",lwd=2 ,pch = 16, ylab = "value", xlab = "items", cex.lab=1.5, cex.axis = 1.5, ylim = c(0, 400000), las=2)
axis(2, at= my.limits)

lines(file1$No., file1$plate,col = 4,type="o",pch = 15,lwd=2)
lines(file1$No., file1$pot ,col = 11,type="o",pch = 17,lwd=2)
lines(file1$No., file1$bowl ,col = 16,type="o",pch = 6,lwd=2)

legend("topleft", legend=c("glass", "plate", "pot", "bowl"),
       col=c("red", 4, 11 , 16), ncol = 2, lty = 1:2, cex=0.8,  adj = c(0, 0.6))