Hello, i'm trying to have the most clear plot for my study and I have a problem.
Firstly i'm using this code:
p=ggplot(GF4, aes(Tache, value,))+
geom_dotplot(binaxis = "y", dotsize= .01)+
geom_jitter(position=position_jitter())+
geom_boxplot(alpha= 0.5)+
geom_signif(comparisons = split(t(combn(levels(GF4$Tache), 2)), seq(nrow(t(combn(levels(GF4$Tache), 2))))),
map_signif_level = TRUE, step_increase=.06)+
theme_classic()+
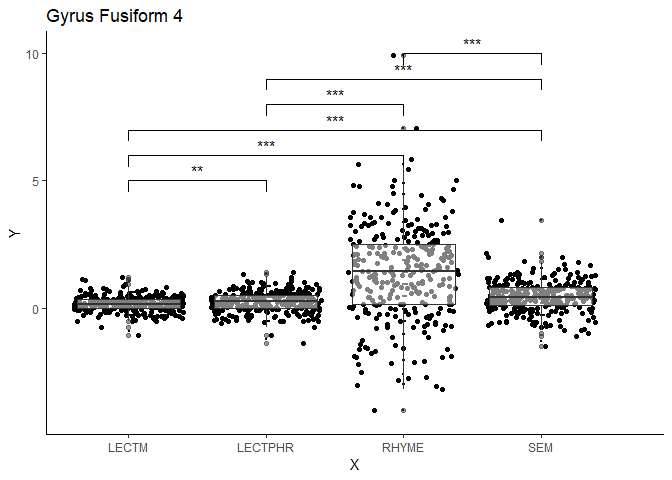
ggtitle("Gyrus Fusiform 4")+
labs(y="Y")+
labs(x="X")
p
I would like to be abble to delete the part of the Y axes from 10 to 15. But when i do
ylim(-5,10)
the significative line vanish because they are to hight, and if i dont know how i can plot them without extending the y axes?
I hope i'm clear...
FJCC
2
Try using the y_position argument of geom_signif
library(ggplot2)
library(ggsignif)
#> Warning: package 'ggsignif' was built under R version 3.5.3
GF4 <- read.csv("c:/users/fxcampos/Documents/R/Play/GF4.csv")
ggplot(GF4, aes(Tache, value,))+
  geom_dotplot(binaxis = "y", dotsize= .01)+
  geom_jitter(position=position_jitter())+
  geom_boxplot(alpha= 0.5)+
  geom_signif(comparisons = split(t(combn(levels(GF4$Tache), 2)), seq(nrow(t(combn(levels(GF4$Tache), 2))))),
              map_signif_level = TRUE, step_increase=.06, y_position = c(5:10))+
  theme_classic()+
  ggtitle("Gyrus Fusiform 4")+
  labs(y="Y")+
  labs(x="X")
#> `stat_bindot()` using `bins = 30`. Pick better value with `binwidth`.
#> Warning: Removed 8 rows containing non-finite values (stat_bindot).
#> Warning: Removed 8 rows containing non-finite values (stat_boxplot).
#> Warning: Removed 8 rows containing non-finite values (stat_signif).
#> Warning: Removed 8 rows containing missing values (geom_point).
Created on 2019-05-25 by the reprex package (v0.2.1)
2 Likes
Thank you for quick answer!
system
Closed
4
This topic was automatically closed 7 days after the last reply. New replies are no longer allowed.