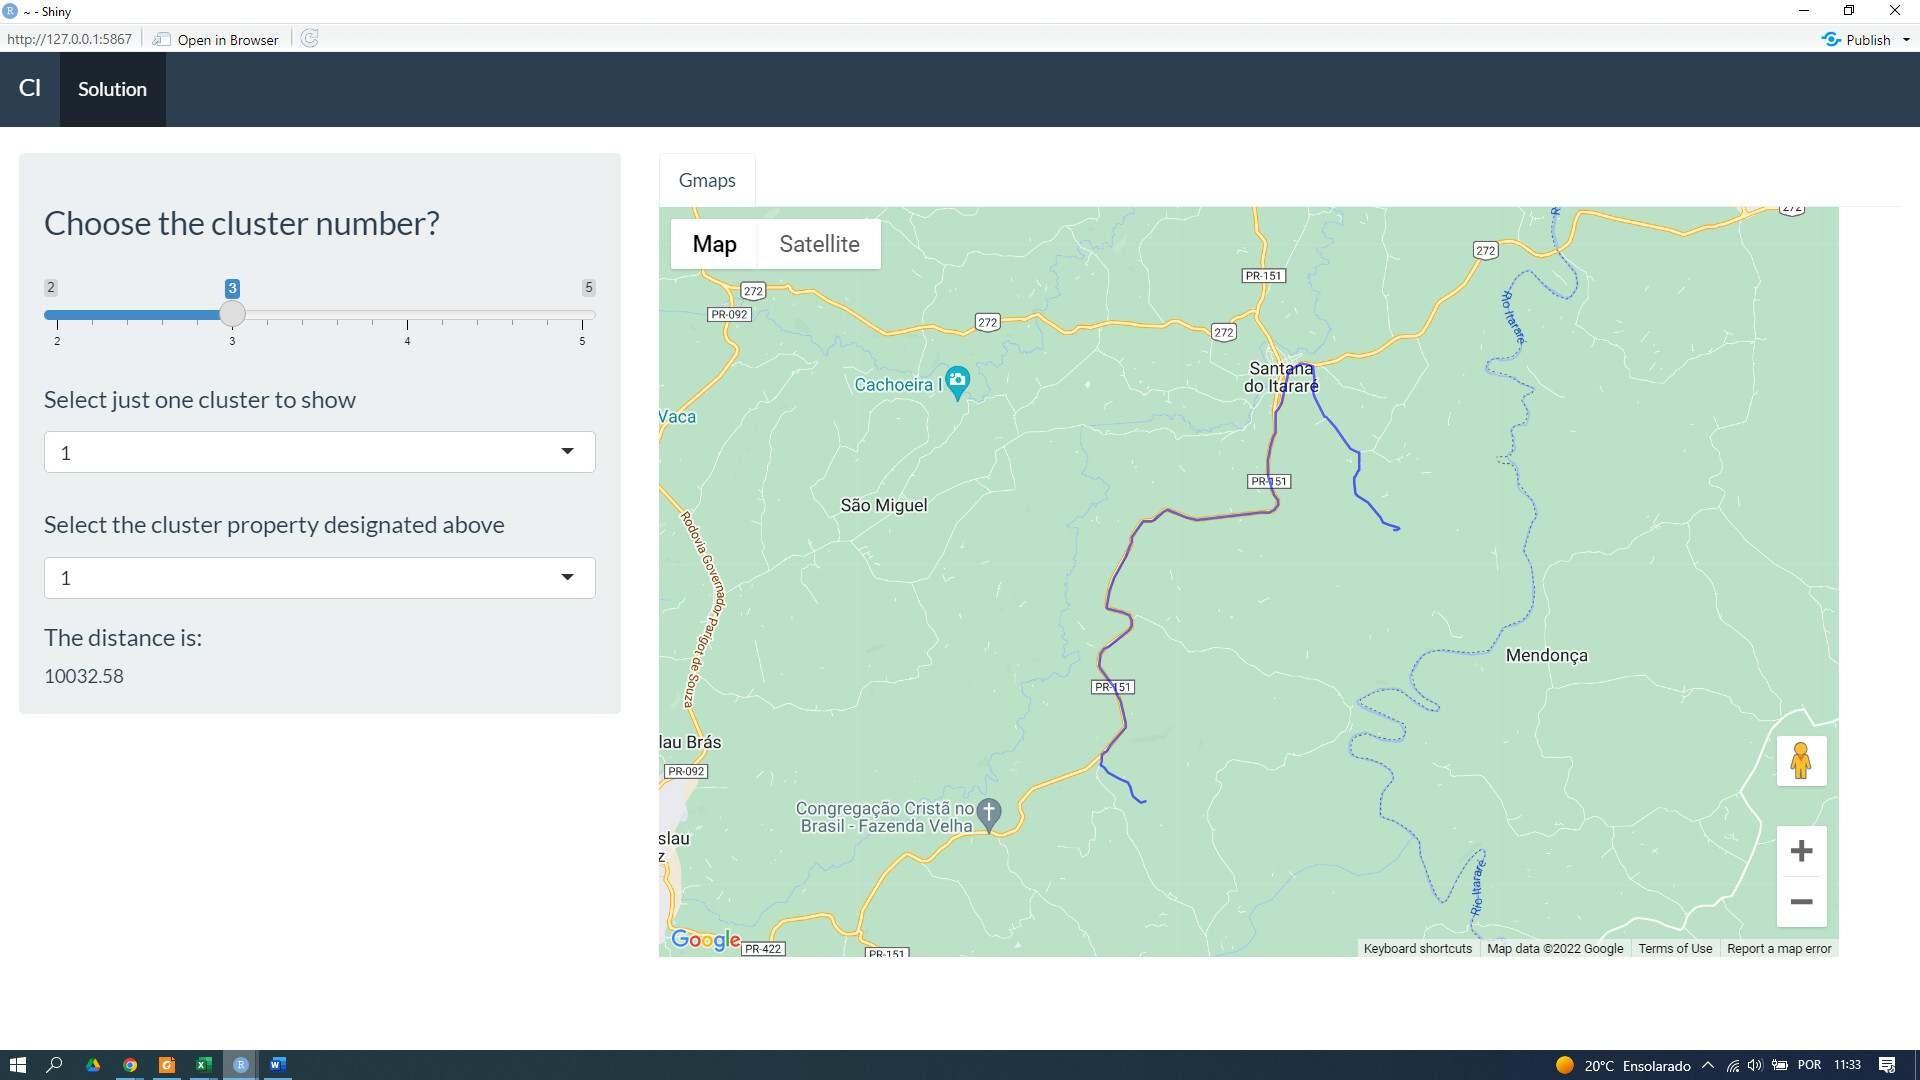
The shiny code below generates the route between two points, using the googleway function. Note that in addition, the distance between the two points is calculated, but this is the Euclidean distance and not the real distance using the googleway functions. The correct way to calculate the distance is by doing the following:
test<-google_directions(origin = c(-24.872139, -50.038787), destination = c(-24.9062992895515, -50.0125745903862), mode = "driving", alternatives = TRUE)

Distance<-sum(as.numeric(direction_steps(test)$distance$value))
However, I would like this form of calculation in the shiny code below, in order to calculate the route properly. Therefore, can you help me adjust the code in shiny?
Code in Shiny
library(shiny)
library(rdist)
library(dplyr)
library(geosphere)
library(shinythemes)
library(leaflet)
library(googleway)

set_key( "AIzaSyBD6kgTlgcTa6iwLwoWtKrKQI6QNodEkmo")

function.cl<-function(df,k,Filter1,Filter2){

  #database df
  df<-structure(list(Properties = c(1,2,3,4,5,6,7),
                     Latitude = c(-23.8, -23.8, -23.9, -23.9, -23.9,-23.4,-23.5),
                     Longitude = c(-49.6, -49.3, -49.4, -49.8, -49.6,-49.4,-49.2),
                     Waste = c(526, 350, 526, 469, 285, 433, 456)), class = "data.frame", row.names = c(NA, -7L))

  #clusters
  coordinates<-df[c("Latitude","Longitude")]
  d<-as.dist(distm(coordinates[,2:1]))
  fit.average<-hclust(d,method="average")
  clusters<-cutree(fit.average, k)
  nclusters<-matrix(table(clusters))
  df$cluster <- clusters

  #database df1
  df1<-matrix(nrow=k,ncol=2)
  for(i in 1:k){
    df1[i,]<-c(weighted.mean(subset(df,cluster==i)$Latitude),
               weighted.mean(subset(df,cluster==i)$Longitude))}
  df1<-cbind(df1,matrix(c(1:k),ncol=1)) %>%
    data.frame()
  colnames(df1)<-c("Latitude","Longitude","cluster")

  #specific cluster and specific propertie
  print(Filter1)
  print(Filter2)
  df_spec_clust <- df1[df1$cluster == Filter1,]
  df_spec_prop<-df[df$Properties==Filter2,]

  #Table to join df and df1
  data_table <- df[order(df$cluster, as.numeric(df$Properties)),]
  data_table_1 <- aggregate(. ~ cluster, df[,c("cluster","Properties")], toString)


  # Map for route
  if(nrow(df_spec_clust>0) & nrow(df_spec_prop>0)) {

    df2<-google_directions(origin = df_spec_clust[,1:2], destination = df_spec_prop[,2:3],
                           mode = "driving")


    df_routes <- data.frame(polyline = direction_polyline(df2))


    m3<-google_map() %>%
      add_polylines(data = df_routes, polyline = "polyline")

    plot1<-m3
  } else {
    plot1 <- NULL
  }

  df2<-google_directions(origin = df_spec_clust[,1:2], destination = df_spec_prop[,2:3],
                         mode = "driving")


  DISTANCE<- merge(df,df1,by = c("cluster"), suffixes = c("_df","_df1"))

  (DISTANCE$distance <- purrr::pmap_dbl(.l = list(DISTANCE$Longitude_df,
                                                    DISTANCE$Latitude_df,
                                                    DISTANCE$Longitude_df1,
                                                    DISTANCE$Latitude_df1),
                                          .f = ~distm(c(..1,..2),c(..3,..4))))


  return(list(
    "Plot1" = plot1,
    "DIST" = DISTANCE,
    "Data" = data_table_1,
    "Data1" = data_table
  ))
}

ui <- bootstrapPage(
  navbarPage(theme = shinytheme("flatly"), collapsible = TRUE,
             "Cl",
             tabPanel("Solution",
                      sidebarLayout(
                        sidebarPanel(
                          tags$b(h3("Choose the cluster number?")),
                          sliderInput("Slider", h5(""),
                                      min = 2, max = 5, value = 3),
                          selectInput("Filter1", label = h4("Select just one cluster to show"),""),
                          selectInput("Filter2",label=h4("Select the cluster property designated above"),""),
                          h4("The distance is:"),
                          textOutput("dist"),
                        ),
                        mainPanel(
                          tabsetPanel(
                            tabPanel("Gmaps", (google_mapOutput("Gmaps",width = "95%", height = "600")))

                      ))))))

server <- function(input, output, session) {

  Modelcl<-reactive({
    function.cl(df,input$Slider,input$Filter1,input$Filter2)
  })


  output$Gmaps <- renderGoogle_map({
    Modelcl()[[1]]
  })

  observeEvent(input$Slider, {
    abc <- req(Modelcl()$Data)
    updateSelectInput(session,'Filter1',
                      choices=sort(unique(abc$cluster)))
  })

  observeEvent(c(input$Slider,input$Filter1),{
    abc <- req(Modelcl()$Data1) %>% filter(cluster == as.numeric(input$Filter1))
    updateSelectInput(session,'Filter2',
                      choices=sort(unique(abc$Properties)))})

  output$dist <- renderText({
    DIST <- data.frame(Modelcl()[[2]])
    DIST$distance[DIST$cluster == input$Filter1 & DIST$Properties == input$Filter2]
  })


}

shinyApp(ui = ui, server = server)
