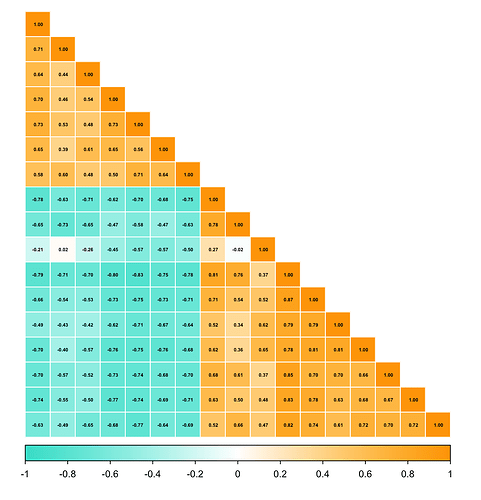
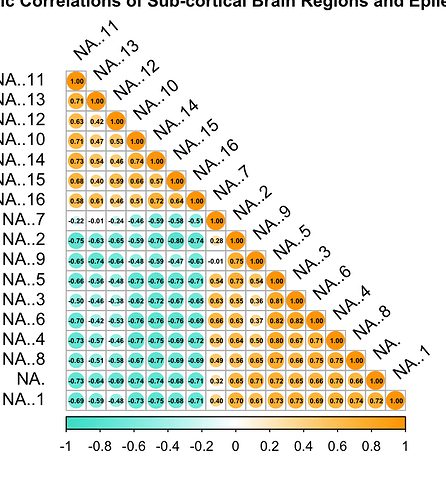
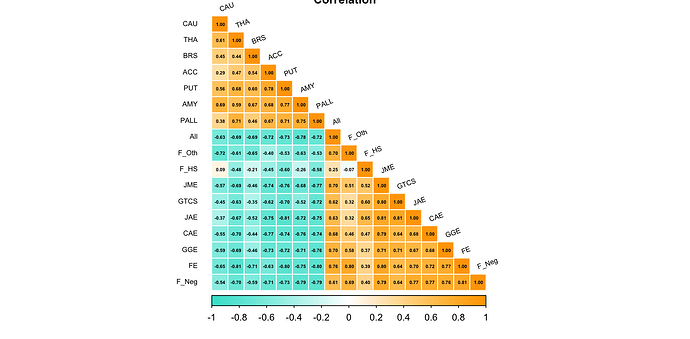
I'm not sure what the data is that you posted. It can't be what is passed to corrplot() because all the values are text (they are wrapped in double quotes), the first column appears to be row names, and some of the values are outside of the range [-1, 1]. I manipulated the data so I could produce a correlation plot of its columns and that plot has the proper labels. If that does not help you get the result you need, please post the data from the object that produced the plot you showed previously with the labels that started with NA..
data <- structure(list(...1 = c("All", "GGE", "FE", "GTCS", "CAE", "JME",
                                "JAE", "F_HS", "F_Neg", "F_Oth", "ACC", "AMY", "BRS", "CAU",
                                "PALL", "PUT", "THA"),
                       All = c("0", "0.9241", "0.8865", "0.9899",
                               "0.983", "0.8471", "0.9437", "0.6045", "0.7427", "0.705", "-0.0324",
                               "-0.0915", "0.0746", "-0.0454", "-0.1761", "-0.0641", "-0.0726"
                       ),
                       GGE = c("0.9241", "0", "0.6148", "0.9451", "1.046", "0.8864",
                               "0.9451", "0.2281", "0.46", "0.7098", "-0.0449", "-0.165", "-0.0942",
                               "-0.0593", "-0.1312", "-0.0077", "-0.0564"),
                       FE = c("0.8865", "0.6148", "0", "0.7344", "0.7326", "0.5694", "0.67", "0.8983",
                              "0.8853", "0.6495", "0.0049", "0.096", "-0.0627", "0.0429", "-0.2017",
                              "-0.0.0847", "-0.0646"),
                       GTCS = c("0.9899", "0.9451", "0.7344",
                                "0", "1.1472", "0.7239", "0.7395", "-0.267", "0.5303", "0.987",
                                "-0.239", "-0.3777", "-0.0728", "-0.1326", "-0.1355", "-0.0546",
                                "-0.068"),
                       CAE = c("0.983", "1.046", "0.7326", "1.1472", "0",
                               "0.7907", "1.0362", "0.2271", "0.4703", "1.0508", "-0.0542",
                               "-0.1365", "-0.1027", "-0.065", "-0.1829", "-0.0709", "-0.0544"
                       ),
                       JME = c("0.8471", "0.8864", "0.5694", "0.7239", "0.7907",
                               "0", "0.6832", "0.2247", "0.4481", "0.8412", "-0.0426", "-0.2074",
                               "-0.1544", "-0.0038", "-0.1703", "0.0105", "-0.1299"),
                       JAE = c("0.9437", "0.9451", "0.67", "0.7395", "1.0362", "0.6832", "0", "0.2063",
                               "0.4054", "1.341", "-0.0798", "-0.1141", "0.0473", "-0.1685",
                               "-0.1764", "-0.0656", "-0.0335"),
                       F_HS = c("0.6045", "0.2281", "0.8983", "-0.267", "0.2271", "0.2247", "0.2063", "0", "0.5171",
                                "2.0792", "0.1217", "-0.118", "-0.216", "-0.0125", "-0.0708",
                                "-0.0096", "-0.0714"),
                       F_Neg = c("0.7427", "0.46", "0.8853", "0.5303", "0.4703", "0.4481", "0.4054", "0.5171", "0", "0.5303",
                                 "0.0871", "0.0395", "-0.0799", "0.0321", "-0.0885", "0.0142",
                                 "-0.0943"),
                       F_Oth = c("0.705", "0.7098", "0.6495", "0.987", "1.0508",
                                 "0.8412", "1.341", "2.0792", "0.5303", "0", "-0.2197", "-0.201",
                                 "-0.0471", "0.1705", "-0.366", "-0.3629", "-0.1624"),
                       ACC = c("-0.0324", "-0.0449", "0.0049", "-0.239", "-0.0542", "-0.0426", "-0.0798",
                               "0.1217", "0.0871", "-0.2197", "0", "0.3194", "0.0654", "0.4447",
                               "0.2815", "0.4359", "0.2733"),
                       AMY = c("-0.0915", "-0.165", "0.096", "-0.3777", "-0.1365", "-0.2074", "-0.1141", "-0.118", "0.0395",
                               "-0.201", "0.3194", "0", "0.0545", "0.1233", "0.1622", "0.2413",
                               "0.2681"),
                       BRS = c("0.0746", "-0.0942", "-0.0627", "-0.0728",
                               "-0.1027", "-0.1544", "0.0473", "-0.216", "-0.0799", "-0.0471",
                               "0.0654", "0.0545", "0", "0.098", "0.4803", "0.1129", "0.4972"
                       ),
                       CAU = c("-0.0454", "-0.0593", "0.0429", "-0.1326", "-0.065",
                               "-0.0038", "-0.1685", "-0.0125", "0.0321", "0.1705", "0.4447",
                               "0.1233", "0.098", "0", "0.3486", "0.508", "0.0764"),
                       PALL = c("-0.1761", "-0.1312", "-0.2017", "-0.1355", "-0.1829", "-0.1703", "-0.1764",
                                "-0.0708", "-0.0885", "-0.366", "0.2815", "0.1622", "0.4803",
                                "0.3486", "0", "0.5521", "0.3878"),
                       PUT = c("-0.0641", "-0.0077", "-0.0.0847", "-0.0546", "-0.0709", "0.0105", "-0.0656", "-0.0096",
                               "0.0142", "-0.3629", "0.4359", "0.2413", "0.1129", "0.508", "0.5521",
                               "0", "0.2192"),
                       THA = c("-0.0726", "-0.0564", "-0.0646", "-0.068", "-0.0544", "-0.1299", "-0.0335", "-0.0714", "-0.0943", "-0.1624",
                               "0.2733", "0.2681", "0.4972", "0.0764", "0.3878", "0.2192", "0"

                       )), class = c("tbl_df", "tbl", "data.frame"), row.names = c(NA, -17L))
library(corrplot)
#> corrplot 0.94 loaded
library(tidyverse)
data2 <- data |> select(-1) |> mutate(across(.col = 1:17, as.numeric))
#> Warning: There were 2 warnings in `mutate()`.
#> The first warning was:
#> ℹ In argument: `across(.col = 1:17, as.numeric)`.
#> Caused by warning:
#> ! NAs introduced by coercion
#> ℹ Run `dplyr::last_dplyr_warnings()` to see the 1 remaining warning.
cor_matrix2 <- cor(data2, use = "complete.obs")

corrplot(cor_matrix2, method = "circle",
         col = colorRampPalette(c("turquoise", "white", "orange"))(400),
         type = "lower",
         order = "hclust",
         addgrid.col = "grey",
         tl.col = "black",
         tl.srt = 40,
         tl.offset = 1,
         number.cex = 0.4,
         addCoef.col = "black",
         title = "Genetic Correlation", cex.main = 1)
#> Warning in ind1:ind2: numerical expression has 2 elements: only the first used

Created on 2024-11-06 with reprex v2.1.1


