there is vignette with about this:
https://cran.r-project.org/web/packages/gridExtra/vignettes/tableGrob.html
and there is a grid.arrange function
And I think cowplot could help to arrange or ggpubr
A <- c(1, 2, 3, 4, 5, 6, 7, 8, 9, 10)
B <- c(10, 9, 8, 7, 6, 5, 4, 3, 2, 1)
C <- data.frame(A, B)
library(ggplot2)
p <- ggplot(data = C) +
geom_point(mapping = aes(x = A, y = B)) +
labs(title = "Plot") +
theme(plot.title = element_text(hjust = 0.5))
tab <- as.data.frame(
c(
Variable_1 = 0.5,
Variable_2 = 0.000035,
Variable_3 = "House"
)
)
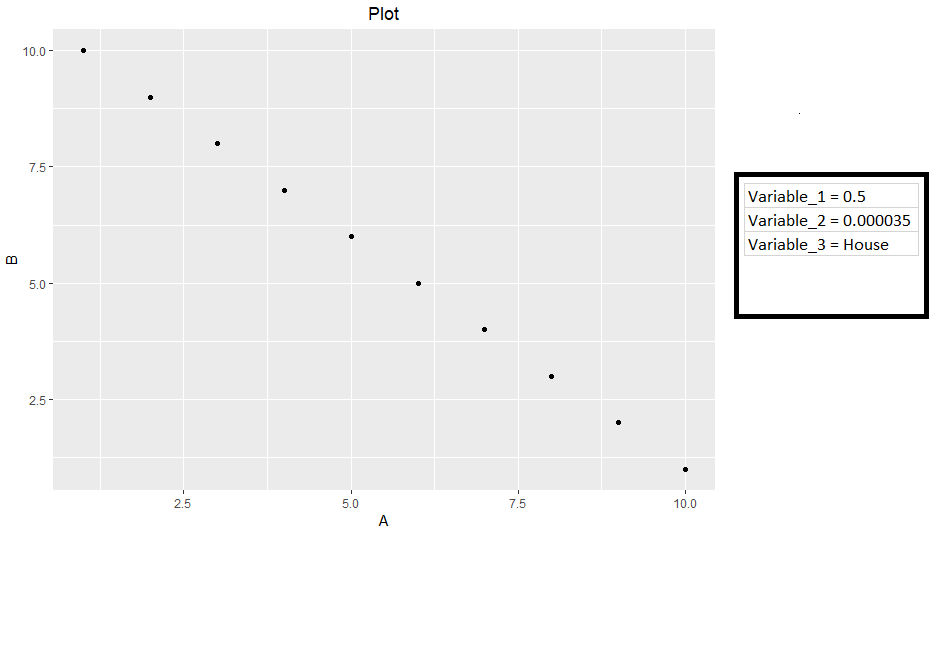
# using gridExtra
library(gridExtra)
p_tab <- tableGrob(unname(tab))
grid.arrange(p, p_tab, ncol = 2)
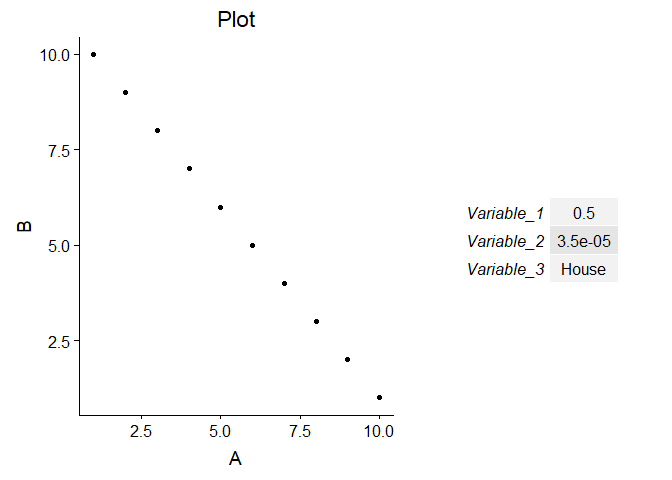
# using cowplot
library(cowplot)
#> Warning: le package 'cowplot' a été compilé avec la version R 3.5.2
#>
#> Attachement du package : 'cowplot'
#> The following object is masked from 'package:ggplot2':
#>
#>     ggsave
ggdraw() +
  draw_plot(p, width = 0.6) +
  draw_plot(p_tab, x = 0.6, width = 0.4)
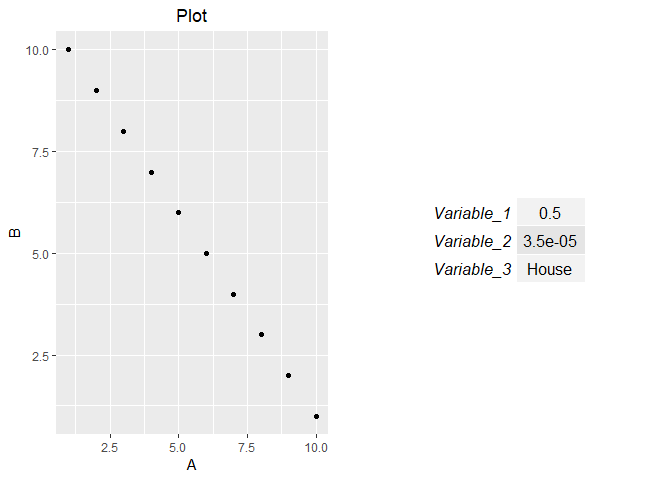
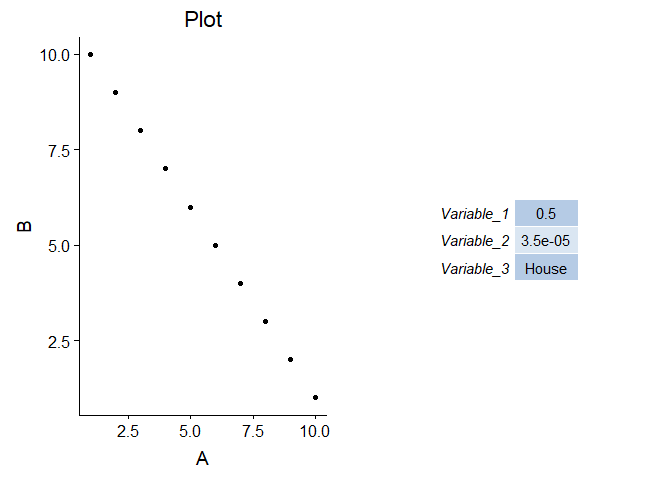
# using ggpubr
library(ggpubr)
#> Le chargement a nécessité le package : magrittr
#>
#> Attachement du package : 'ggpubr'
#> The following object is masked from 'package:cowplot':
#>
#>     get_legend
gp_tab <- ggtexttable(unname(tab), theme = ttheme("mBlue"))
ggarrange(p, gp_tab, ncol = 2)
Created on 2019-01-21 by the reprex package (v0.2.1)
You can read the vignettes of all these  , there are some example about arranging plot.