Hi all,
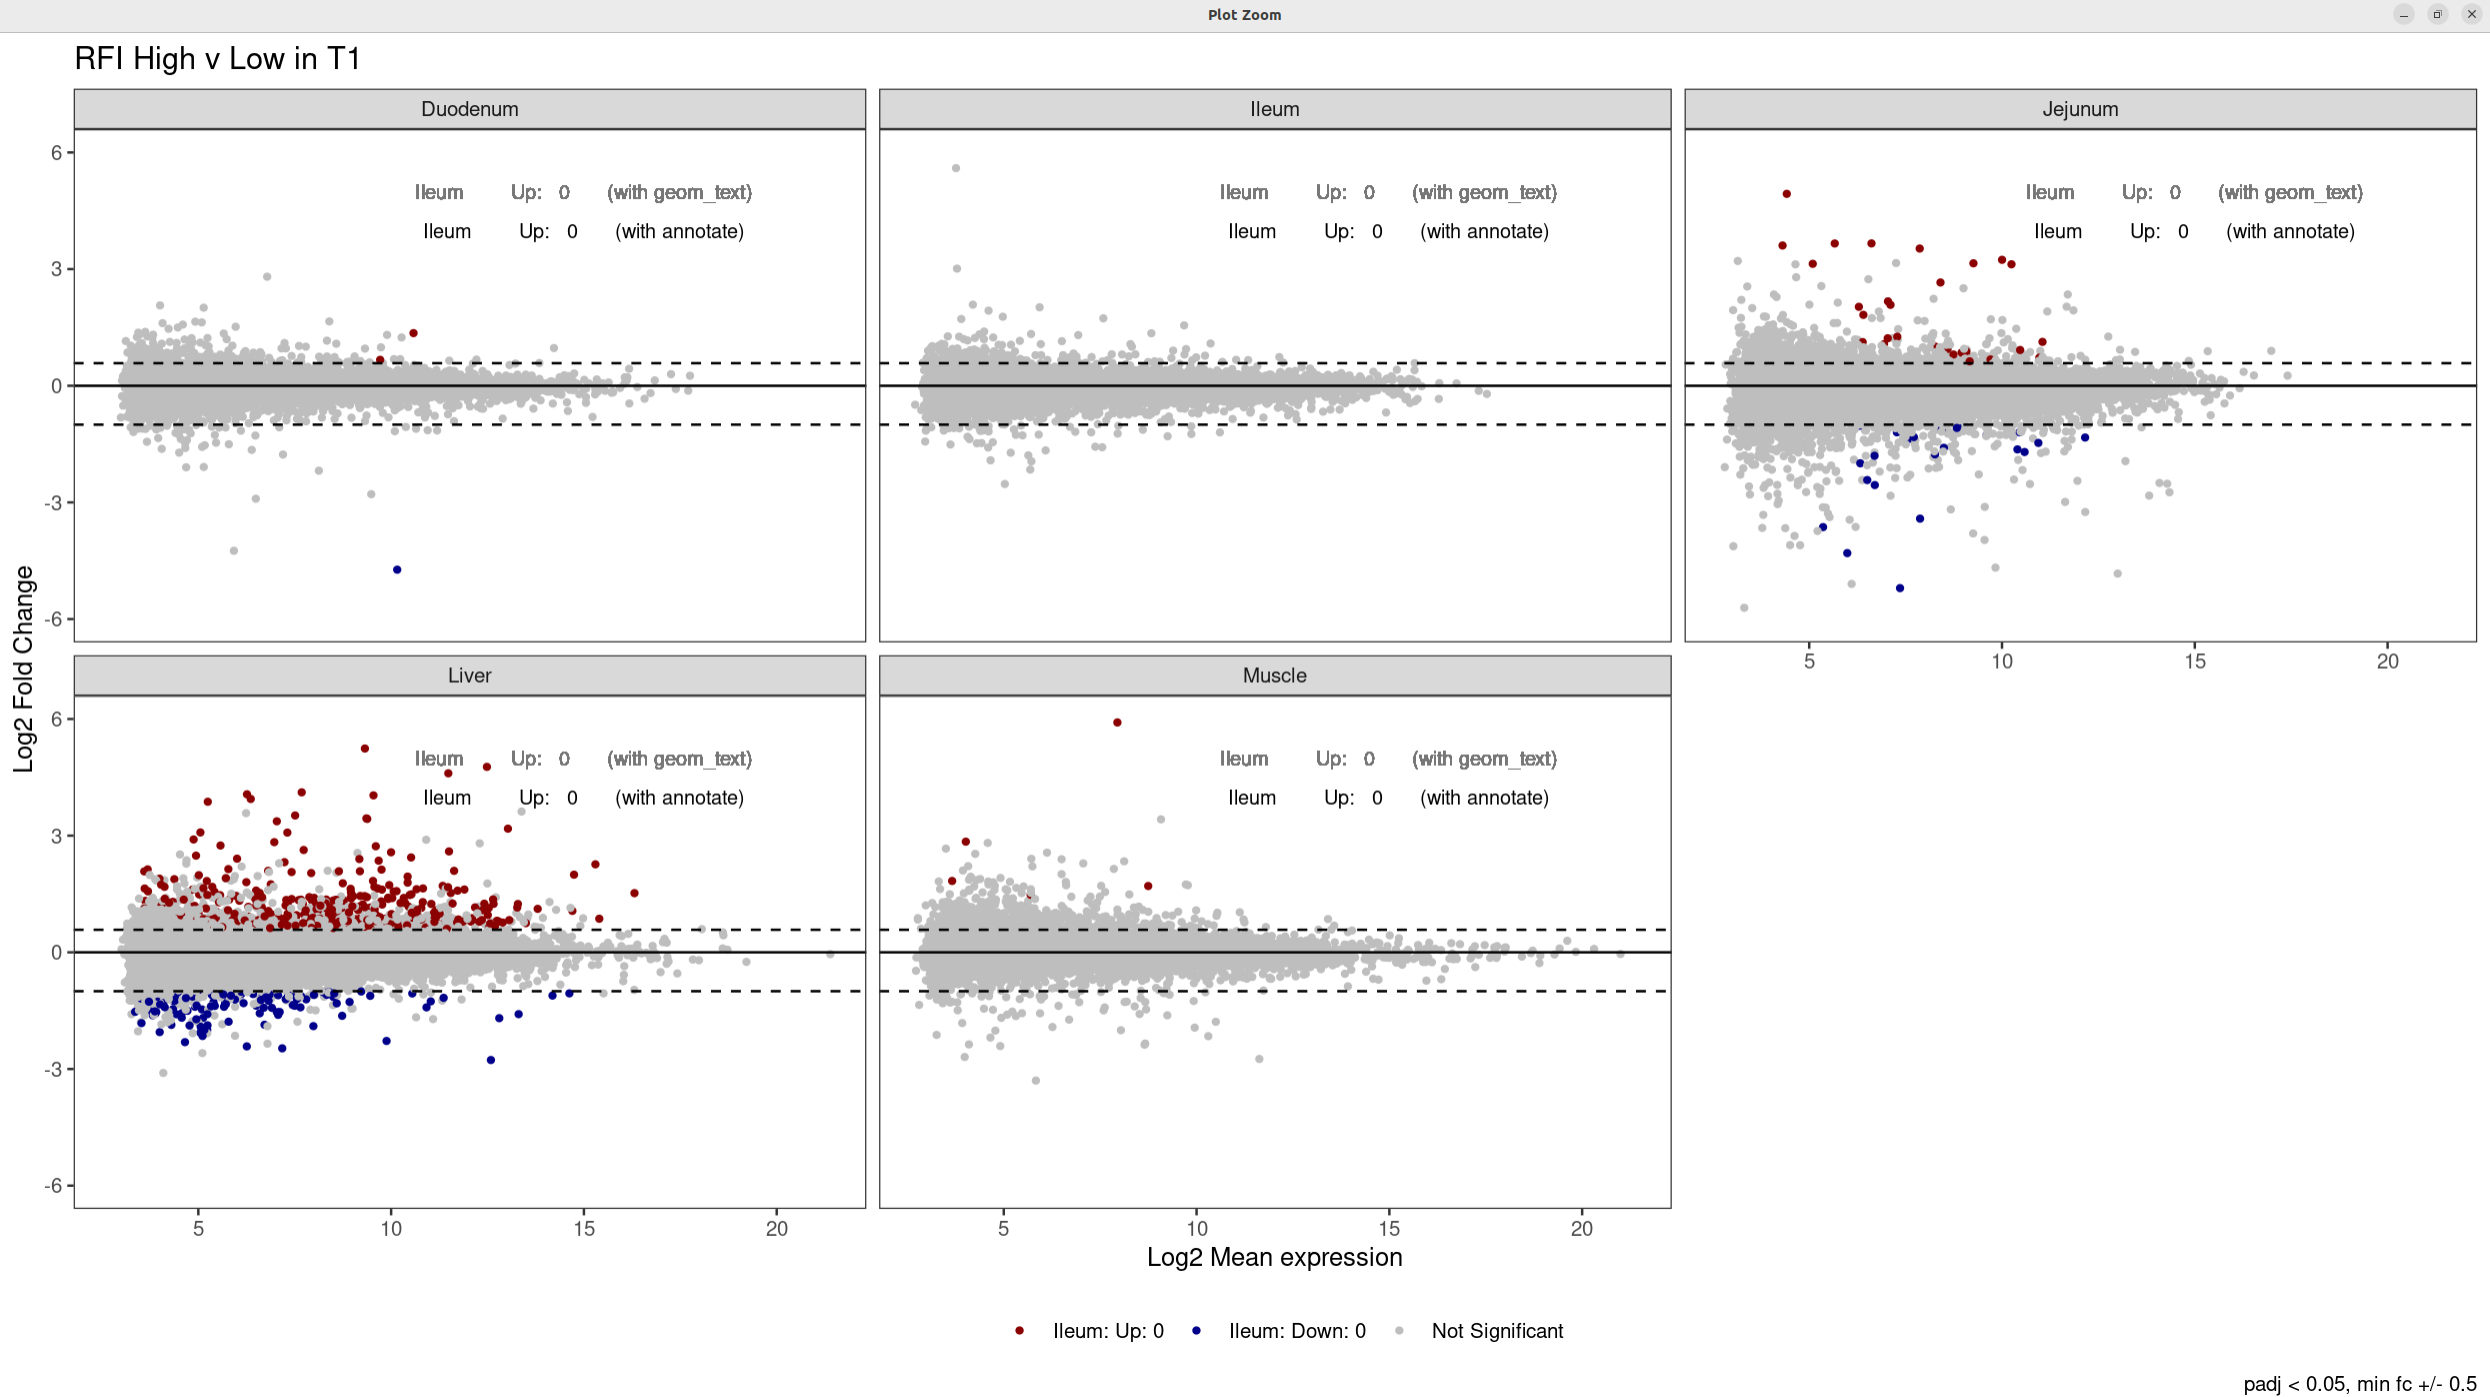
I am adding 5 MA plots to facet_wrap, 1 for each tissue, showing the differential expression results from deseq2. For each plot, I want to add the total count of Up and Down regulated genes. It works perfectly well on an individual plot, but not when the plots are wrapped together. I am trying 3 options: geom_text, annotate, and scale_color_manual. However, no matter what I try, all numbers on the plot are from the same tissue (Ileum).
Thanks everyone in advance.
Kenneth
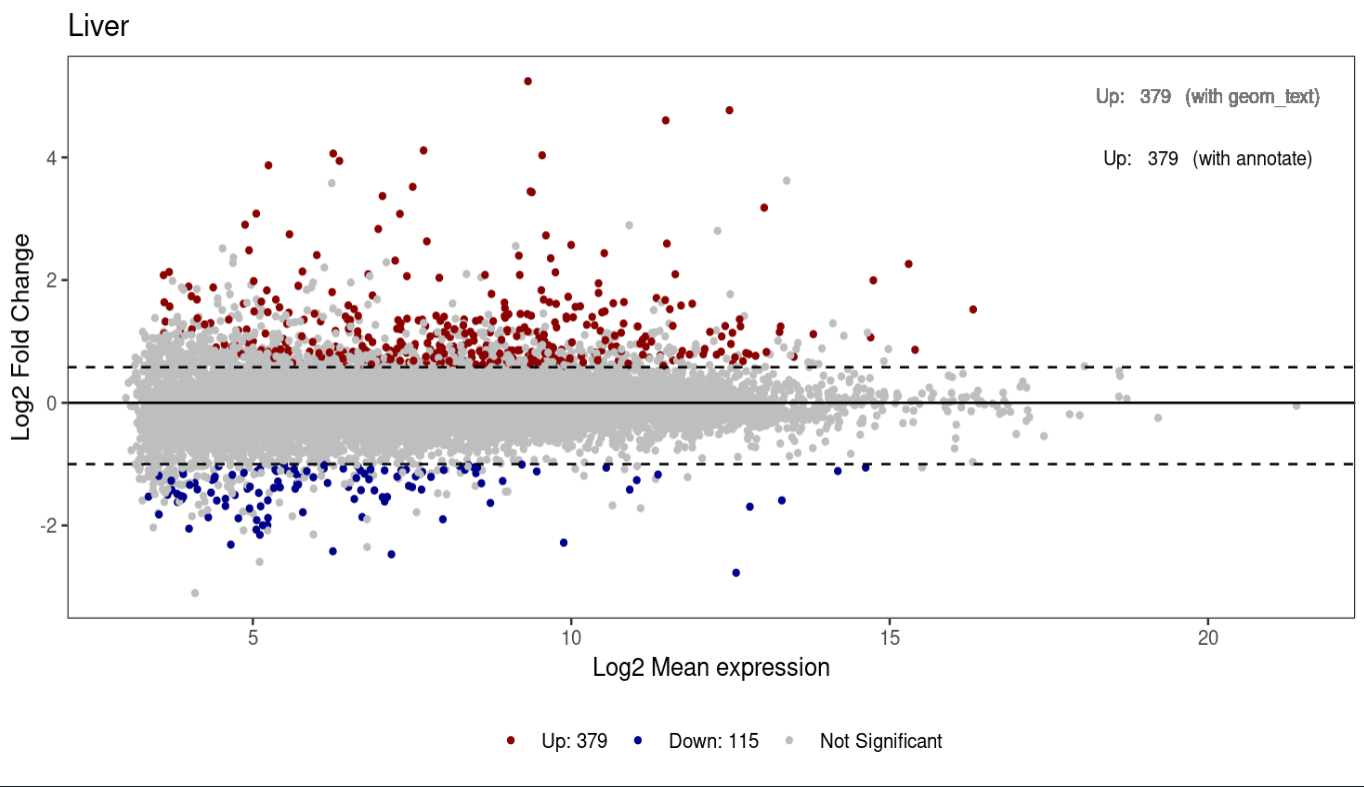
For a single tissue
Data structure/summary:
> head(res)
# A tibble: 6 × 3
  baseMean log2FoldChange signif
     <dbl>          <dbl> <fct>
1   82014.          0.115 NS
2     555.          0.328 NS
3     119.          0.512 NS
4     127.          0.115 NS
5     232.         -0.230 NS
6    1200.         -0.125 NS
> summary(res$signif)
   Up  Down    NS
  379   115 13831
Create Plot for one tissue:
ggplot(data=res, aes(x = log2(baseMean), y = log2FoldChange, colour = signif))+
  geom_point(alpha = 1, size = 1, show.legend = TRUE) +
  geom_hline(aes(yintercept = 0), colour = "black", linewidth = 0.5) +
  geom_hline(aes(yintercept = 0.58), colour = "black", linewidth = 0.5, linetype = "dashed") +
  geom_hline(aes(yintercept = -1), colour = "black", linewidth = 0.5, linetype = "dashed") +

  ######## TESTING #######
# option 1
geom_text(aes(x = 20, y = 5, label = paste("Up:", sum(signif=="Up"), "(with geom_text)", sep = "\t")), size = 3, color = colorspace::lighten("black", amount = 0.5)) +

  # option 2
  annotate(geom="text", x = 20, y = 4, label = paste("Up:", sum(res$signif=="Up"), "(with annotate)", sep = "\t"), size = 3) +

  # option 3
  scale_color_manual(values = c("darkred", "darkblue", "grey"),
                     labels = c(paste("Up", sum(res$signif=="Up"), sep = ": "),
                                paste("Down", sum(res$signif=="Down"), sep = ": "),
                                "Not Significant"),
                     drop = FALSE) +
  ########################
  labs(title = "Liver",
       color = "") +
  xlab("Log2 Mean expression") +
  ylab("Log2 Fold Change") +
  theme_bw()+
  theme(
    #legend.position = "inside",
    #legend.position.inside = c(0.9, 0.85),
    legend.position = "bottom",
    panel.grid.major = element_blank(),
    panel.grid.minor = element_blank(),
    strip.background = element_rect()
  )
For all tissues
Data structure/summary:
> head(res_signif)
# A tibble: 6 × 4
baseMean log2FoldChange signif tissue
<dbl> <dbl> <fct> <chr>
1 25297. 0.0696 NS Duodenum
2 934. -0.128 NS Duodenum
3 286. 0.346 NS Duodenum
4 573. 0.0357 NS Duodenum
5 1242. 0.146 NS Duodenum
6 117. -0.185 NS Duodenum
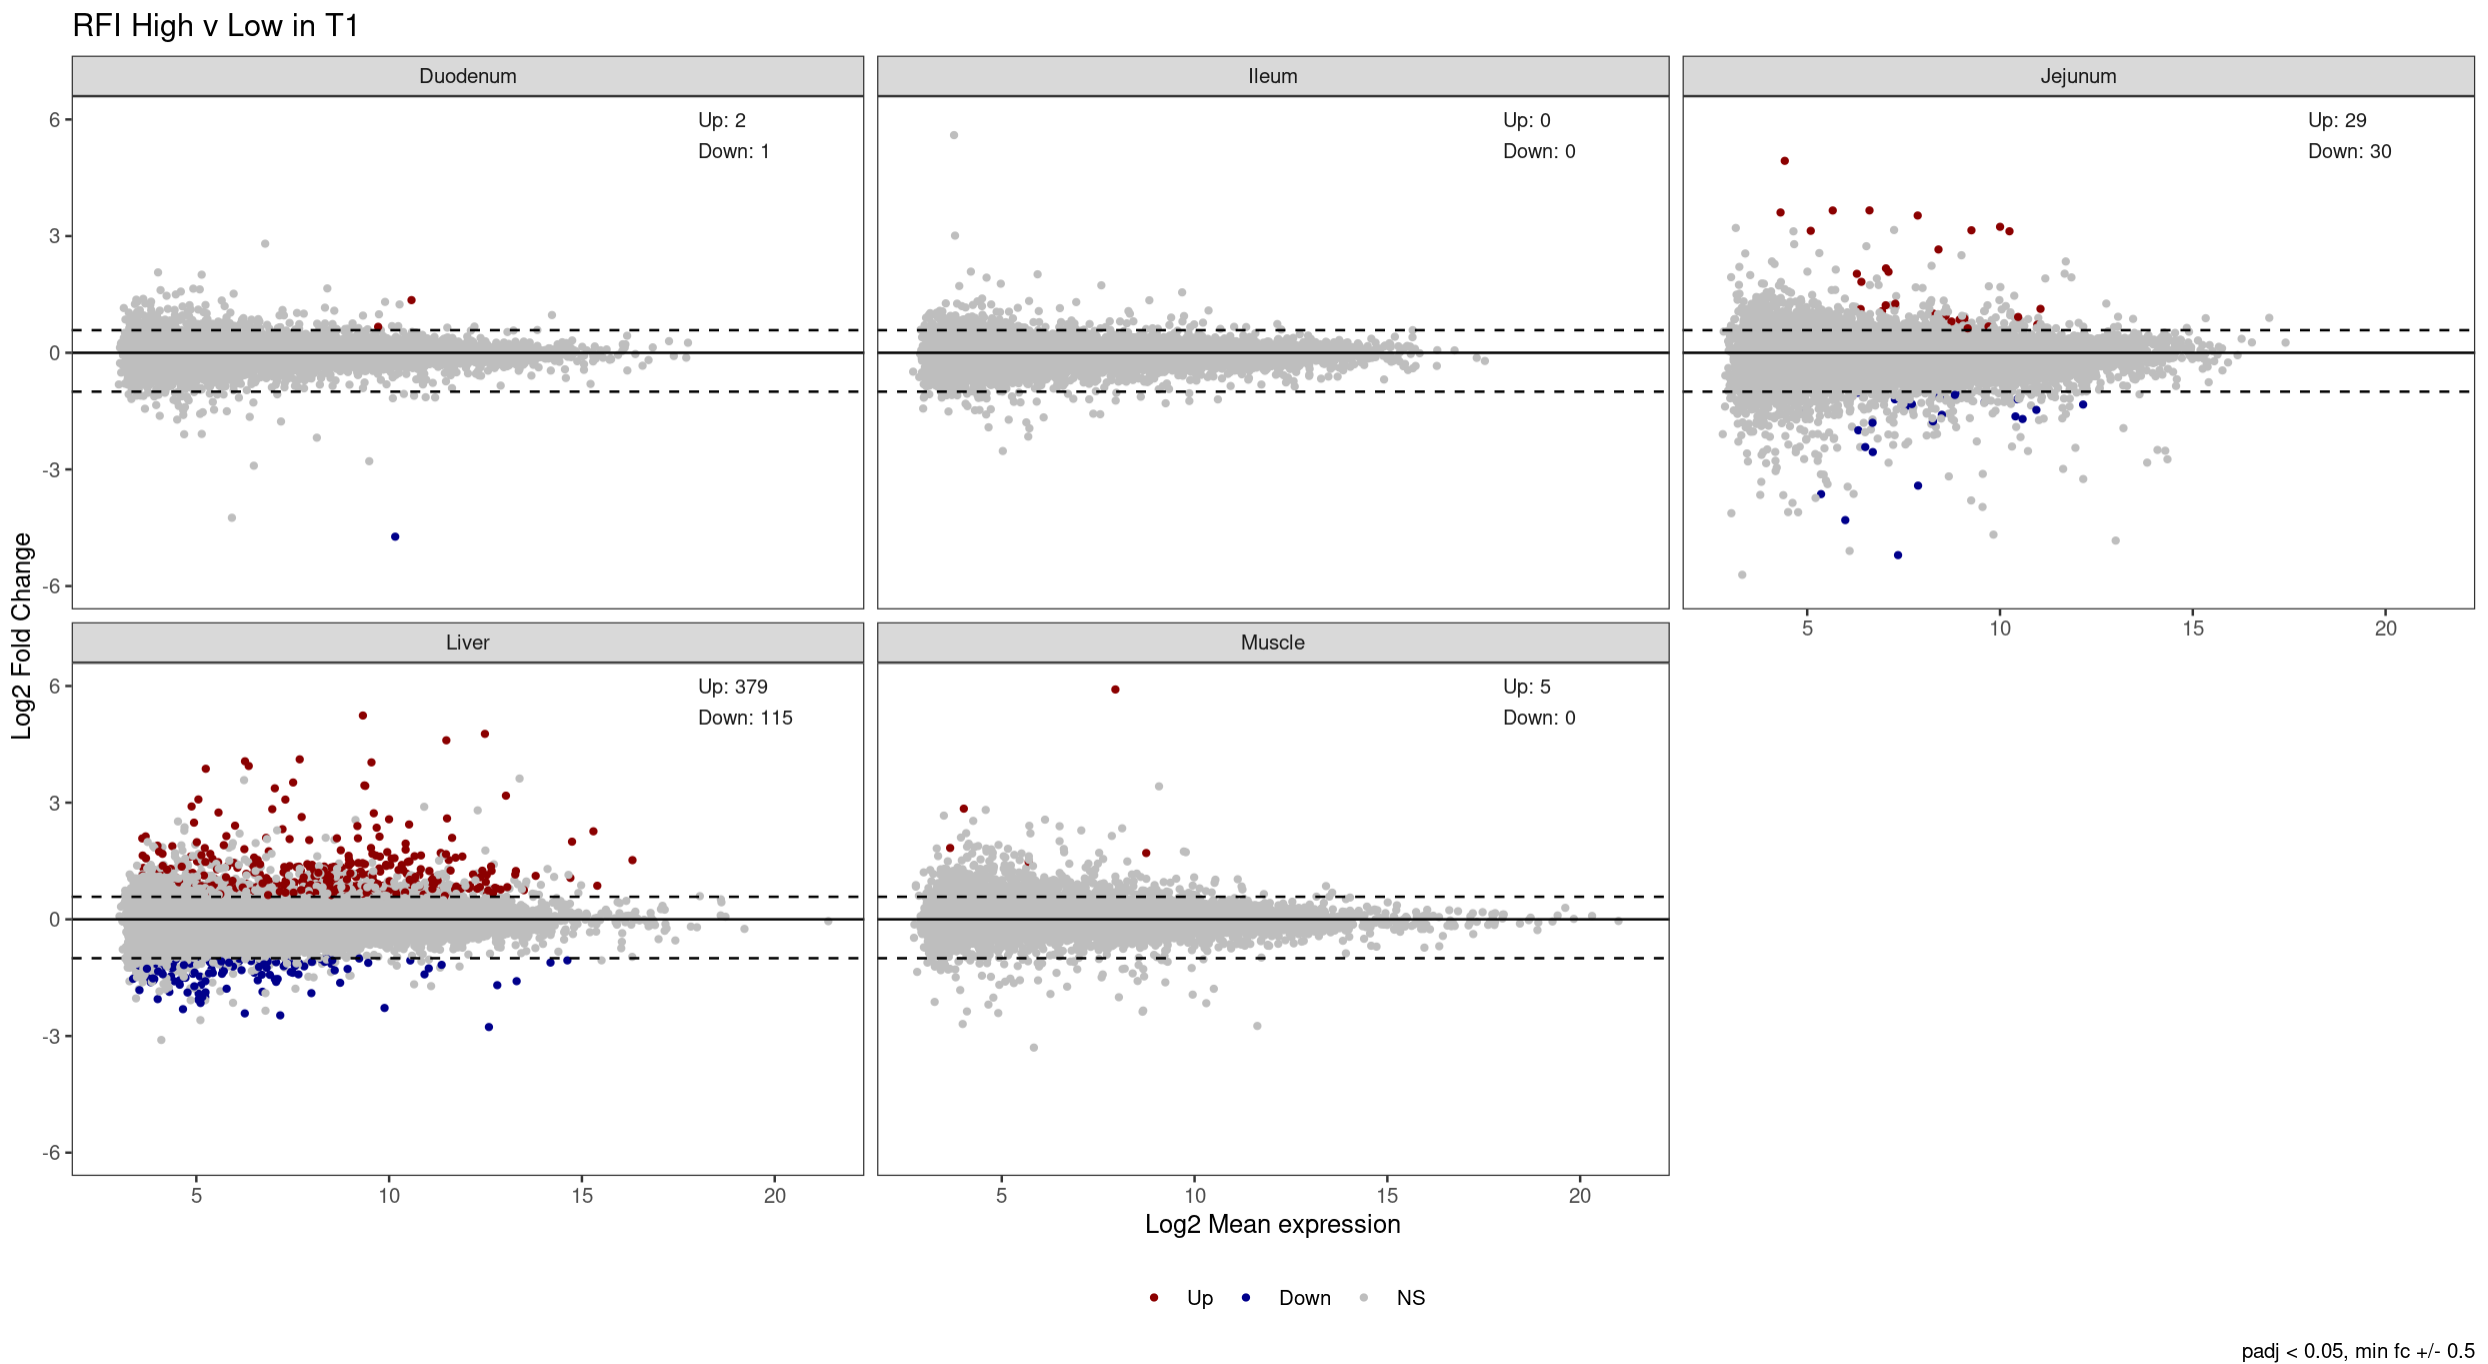
> counts
# A tibble: 5 × 4
tissue Up Down NS
<chr> <int> <int> <int>
1 Duodenum 2 1 15711
2 Ileum 0 0 16069
3 Jejunum 29 30 15830
4 Liver 379 115 13831
5 Muscle 5 0 13154
Create plot for all tissues with facet_wrap:
ggplot(data = res_signif, aes(x = log2(baseMean), y = log2FoldChange, colour = signif))+
  geom_point(alpha = 1, size = 1, show.legend = TRUE) +
  geom_hline(aes(yintercept = 0), colour = "black", linewidth = 0.5) +
  geom_hline(aes(yintercept = 0.58), colour = "black", linewidth = 0.5, linetype = "dashed") +
  geom_hline(aes(yintercept = -1), colour = "black", linewidth = 0.5, linetype = "dashed") +
  ylim(-6, 6) +
  labs(title = "RFI High v Low in T1",
       caption = "padj < 0.05, min fc +/- 0.5",
       color = "") +
  xlab("Log2 Mean expression") +
  ylab("Log2 Fold Change") +

  ######## TESTING #######
  # option 1
  geom_text(aes(x = 15, y = 5, label = paste(name, "Up:", pull(filter(counts, tissue == name), Up), "(with geom_text)", sep = "\t")), size = 3, color = colorspace::lighten("black", amount = 0.5)) +

  # option 2
  annotate(geom="text", x = 15, y = 4, label = paste(name, "Up:", pull(filter(counts, tissue == name), Up), "(with annotate)", sep = "\t"), size = 3) +

  # option 3
  scale_color_manual(values = c("darkred", "darkblue", "grey"),
                     labels = c(paste(name, "Up", pull(filter(counts, tissue == name), Up), sep = ": "),
                                paste(name, "Down", pull(filter(counts, tissue == name), Up), sep = ": "),
                                "Not Significant"),
                     drop = FALSE
  ) +
  ########################
  theme_bw()+
  theme(
    #legend.position = "inside",
    #legend.position.inside = c(0.9, 0.85),
    legend.position = "bottom",
    panel.grid.major = element_blank(),
    panel.grid.minor = element_blank(),
    strip.background = element_rect()
  ) + facet_wrap(vars(tissue))