Hello! I'd like to add a label for the total count of the bar to the following- i.e. # cases enrolled at the end of the bar
ggplot(df_tempSSD) + aes(x =date_enrollment, fill=data_collector) +
labs(title= "Enrollment by Enumerator, SSD- March") +
geom_bar() + theme(legend.title = element_blank()) +
scale_y_continuous(name="Number of Cases Enrolled") +
xlab("Date in March")
FJCC
2
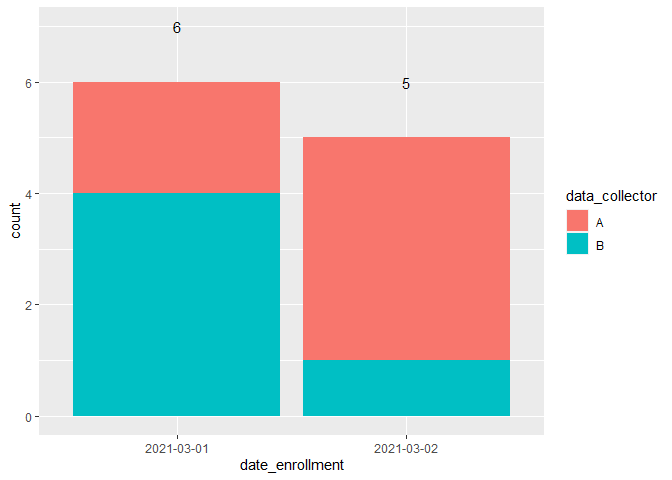
I had to guess what your data look like, so I hope this is close enough.
library(ggplot2)
library(dplyr, warn.conflicts = FALSE)
DF <- data.frame(date_enrollment = c("2021-03-01","2021-03-01","2021-03-01","2021-03-01",
                                     "2021-03-01","2021-03-01","2021-03-02","2021-03-02",
                                     "2021-03-02","2021-03-02","2021-03-02"),
                 data_collector = c("A", "A", "B", "B", "B", "B", "A", "A", "A", "A", "B"))

Totals <- DF %>% group_by(date_enrollment) %>% summarize(N = n())
#> `summarise()` ungrouping output (override with `.groups` argument)
ggplot(DF, aes(date_enrollment)) + geom_bar(aes(fill = data_collector)) +
  geom_text(aes(y = N + 1, label = N), data = Totals)
Created on 2021-03-30 by the reprex package (v0.3.0)
system
Closed
3
This topic was automatically closed 21 days after the last reply. New replies are no longer allowed.
If you have a query related to it or one of the replies, start a new topic and refer back with a link.