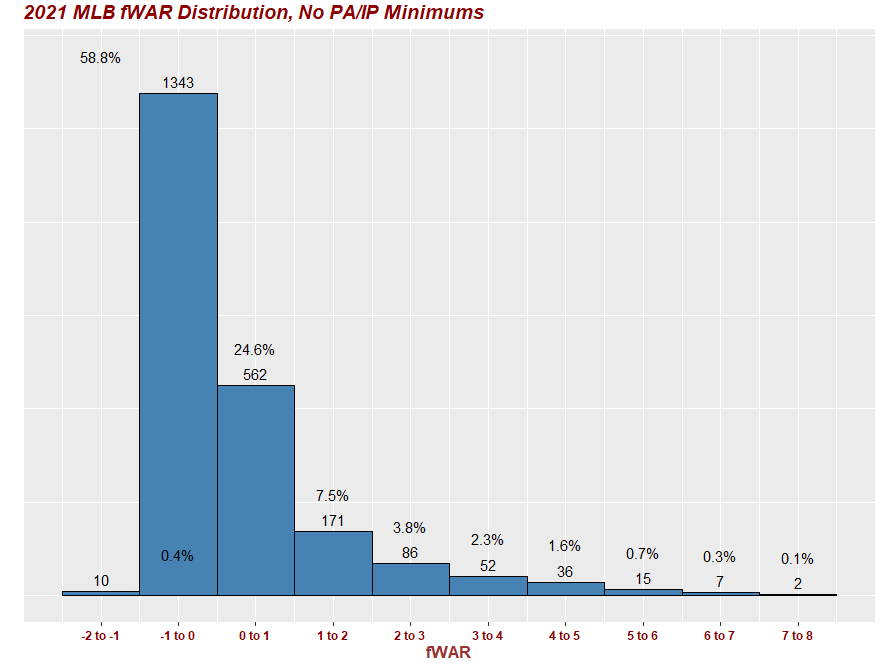
Been working on this project and nearing completion... my code is below and associated viz.
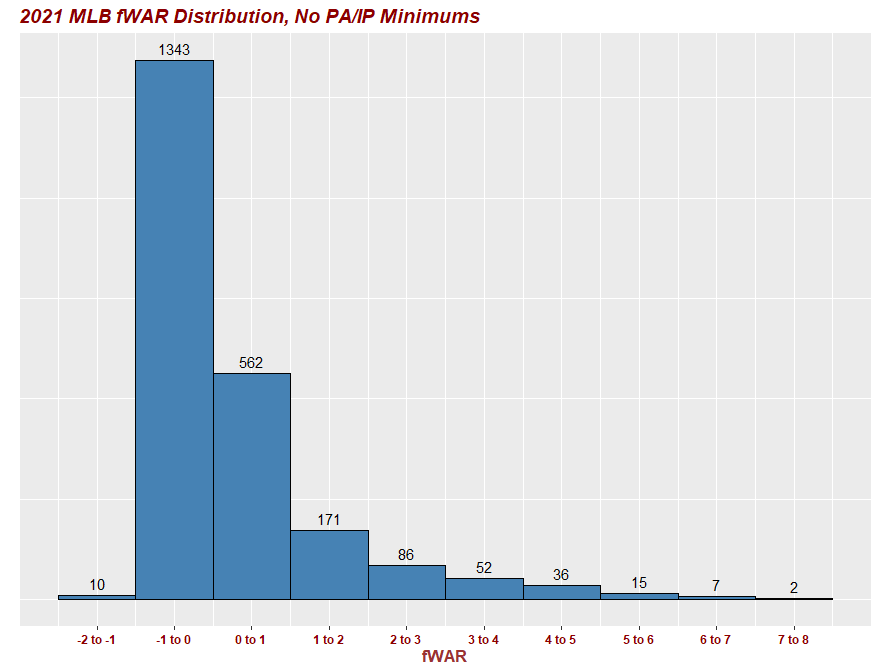
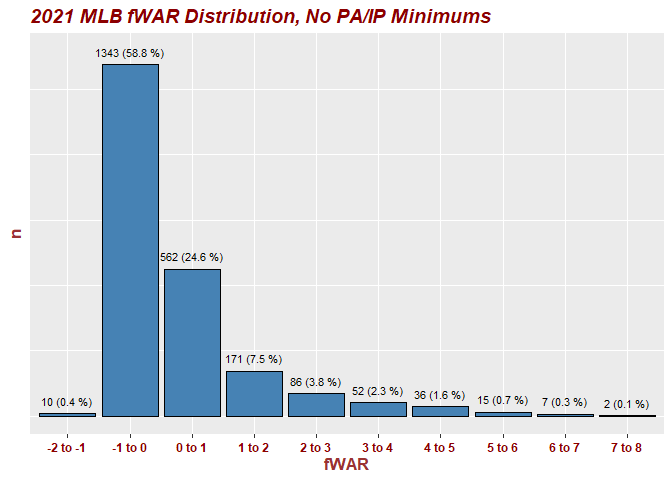
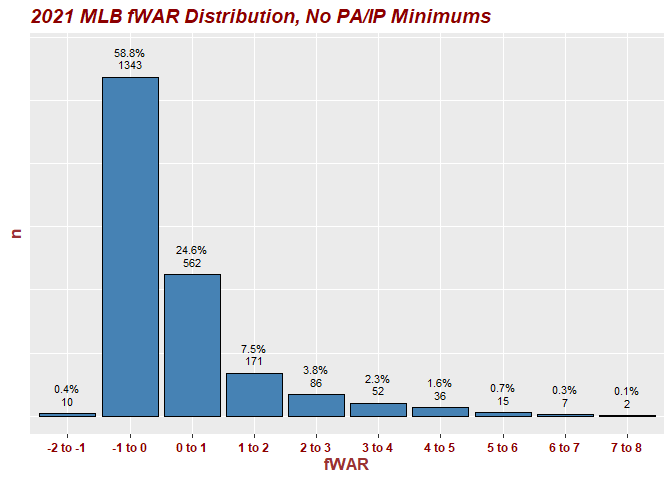
I want to add a percentage to the top of each histogram bar/column WHILE MAINTAINING counts in the X axis. The counts are there but how do I add percentages to each inside the bar or above the counts above the bar (indifferent on the cosmetics here)?
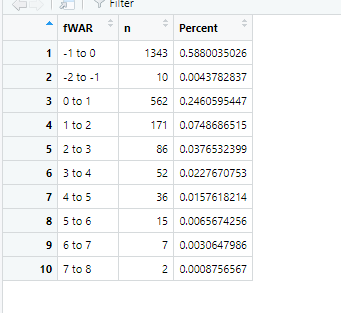
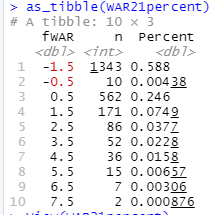
In my DataFrames for this first ggplot (WAR21percent which is pictured at the bottom of this post) I have a Percent column with the numbers I want (would like to get it down to one decimal point, but that's another story and issue) from this dataframe to get onto the viz.
Where can I add this in? I used stat_bin to get the counts on the x axis. How can I add percents? Open to and appreciate all recs!
library(dplyr)
library(base)
library(dplyr)
library(tidyverse)
WAR <- read.csv("WAR.csv")
View(WAR)
## Only Pitchers displayed in a DF
pitchers <- filter(WAR, Type == "Pitcher")
View(pitchers)
##2020 pitchers only
pitchers20 <- filter(pitchers, year == 2020)
View(pitchers20)
##2021 pitchers only
pitchers21 <- filter(pitchers, year == 2021)
View(pitchers21)
##Only Hitters displayed in a DF
hitters <- filter(WAR, Type == "Hitter")
##2020 hitters only
hitters20 <- filter(hitters, year == 2020)
##2021 hitters only
hitters21 <- filter(hitters, year == 2021)
##2020 all WAR
WAR20 <- filter (WAR, year ==2020)
#2021 all WAR
WAR21 <- filter( WAR, year == 2021)

View(WAR21)

#Summary counts of the datasets
WAR21_labels = WAR21 %>%
  count(WAR)

#Summary counts of the datasets 2020
WAR20_labels = WAR20 %>%
  count(WAR)

pitchers21_labels = pitchers21 %>%
  count(WAR)

pitchers20_labels = pitchers20 %>%
  count(WAR)

hitters20_labels = hitters20 %>%
  count(WAR)

hitters21_labels = hitters21 %>%
  count(WAR)

View(WAR21_labels)

View(WAR20_labels)

View(pitchers21)

##Using case_when to create WAR bins and then counting up these bins using count function for 2021 ALL

WAR21_subset <- WAR21 %>%
  mutate(fWAR = case_when(WAR >= -2 & WAR <= -1 ~ "-2 to -1",
                          WAR >= -1 & WAR <= 0 ~ "-1 to 0",
                          WAR >= 0 & WAR <= 1 ~ "0 to 1",
                          WAR >= 1 & WAR <= 2 ~ "1 to 2",
                          WAR >= 2 & WAR <= 3 ~ "2 to 3",
                          WAR >= 3 & WAR <= 4 ~ "3 to 4",
                          WAR >= 4 & WAR <= 5 ~ "4 to 5",
                          WAR >= 5 & WAR <= 6 ~ "5 to 6",
                          WAR >= 6 & WAR <= 7 ~ "6 to 7",
                          WAR >= 7 & WAR <= 8 ~ "7 to 8",))


WAR21_labels =  WAR21_subset %>%
  count(fWAR)

##For 2020 ALL

WAR20_subset <- WAR20 %>%
  mutate(fWAR = case_when(WAR >= -2 & WAR <= -1 ~ "-2 to -1",
                          WAR >= -1 & WAR <= 0 ~ "-1 to 0",
                          WAR >= 0 & WAR <= 1 ~ "0 to 1",
                          WAR >= 1 & WAR <= 2 ~ "1 to 2",
                          WAR >= 2 & WAR <= 3 ~ "2 to 3",
                          WAR >= 3 & WAR <= 4 ~ "3 to 4",
                          WAR >= 4 & WAR <= 5 ~ "4 to 5",
                          WAR >= 5 & WAR <= 6 ~ "5 to 6",
                          WAR >= 6 & WAR <= 7 ~ "6 to 7",
                          WAR >= 7 & WAR <= 8 ~ "7 to 8",))


WAR20_labels =  WAR20_subset %>%
  count(fWAR)

##For 2021 pitchers

pitchers21_subset <- pitchers21 %>%
  mutate(fWAR = case_when(WAR >= -2 & WAR <= -1 ~ "-2 to -1",
                          WAR >= -1 & WAR <= 0 ~ "-1 to 0",
                          WAR >= 0 & WAR <= 1 ~ "0 to 1",
                          WAR >= 1 & WAR <= 2 ~ "1 to 2",
                          WAR >= 2 & WAR <= 3 ~ "2 to 3",
                          WAR >= 3 & WAR <= 4 ~ "3 to 4",
                          WAR >= 4 & WAR <= 5 ~ "4 to 5",
                          WAR >= 5 & WAR <= 6 ~ "5 to 6",
                          WAR >= 6 & WAR <= 7 ~ "6 to 7",
                          WAR >= 7 & WAR <= 8 ~ "7 to 8",))


pitchers21_labels =  pitchers21_subset %>%
  count(fWAR)

##For 2020 pitchers

pitchers20_subset <- pitchers20 %>%
  mutate(fWAR = case_when(WAR >= -2 & WAR <= -1 ~ "-2 to -1",
                          WAR >= -1 & WAR <= 0 ~ "-1 to 0",
                          WAR >= 0 & WAR <= 1 ~ "0 to 1",
                          WAR >= 1 & WAR <= 2 ~ "1 to 2",
                          WAR >= 2 & WAR <= 3 ~ "2 to 3",
                          WAR >= 3 & WAR <= 4 ~ "3 to 4",
                          WAR >= 4 & WAR <= 5 ~ "4 to 5",
                          WAR >= 5 & WAR <= 6 ~ "5 to 6",
                          WAR >= 6 & WAR <= 7 ~ "6 to 7",
                          WAR >= 7 & WAR <= 8 ~ "7 to 8",))


pitchers20_labels =  pitchers20_subset %>%
  count(fWAR)

##for 2020 hitters
hitters20_subset <- hitters20 %>%
  mutate(fWAR = case_when(WAR >= -2 & WAR <= -1 ~ "-2 to -1",
                          WAR >= -1 & WAR <= 0 ~ "-1 to 0",
                          WAR >= 0 & WAR <= 1 ~ "0 to 1",
                          WAR >= 1 & WAR <= 2 ~ "1 to 2",
                          WAR >= 2 & WAR <= 3 ~ "2 to 3",
                          WAR >= 3 & WAR <= 4 ~ "3 to 4",
                          WAR >= 4 & WAR <= 5 ~ "4 to 5",
                          WAR >= 5 & WAR <= 6 ~ "5 to 6",
                          WAR >= 6 & WAR <= 7 ~ "6 to 7",
                          WAR >= 7 & WAR <= 8 ~ "7 to 8",))


hitters20_labels =  hitters20_subset %>%
  count(fWAR)

##for 2021 hitters
hitters21_subset <- hitters21 %>%
  mutate(fWAR = case_when(WAR >= -2 & WAR <= -1 ~ "-2 to -1",
                          WAR >= -1 & WAR <= 0 ~ "-1 to 0",
                          WAR >= 0 & WAR <= 1 ~ "0 to 1",
                          WAR >= 1 & WAR <= 2 ~ "1 to 2",
                          WAR >= 2 & WAR <= 3 ~ "2 to 3",
                          WAR >= 3 & WAR <= 4 ~ "3 to 4",
                          WAR >= 4 & WAR <= 5 ~ "4 to 5",
                          WAR >= 5 & WAR <= 6 ~ "5 to 6",
                          WAR >= 6 & WAR <= 7 ~ "6 to 7",
                          WAR >= 7 & WAR <= 8 ~ "7 to 8",))


hitters21_labels =  hitters21_subset %>%
  count(fWAR)


View(pitchers21_labels)

View(WAR20_subset)

View(WAR21_subset)

View(WAR21_labels)

View(pitchers20_labels)

View(pitchers20)

as_tibble(hitters21)

View(hitters21)

as_tibble(hitters20)

View(WAR21)

library(scales)

##adding percent to the dataFrame. How do I add it above the histogram below???
WAR21percent <- WAR21_labels %>%
  mutate(Percent = n/2284)

##adding percent to the 2020 dataFrame. How do I add it above the histogram below???
WAR20percent <- WAR20_labels %>%
  mutate(Percent = n/1356)

pitchers21percent <- pitchers21_labels %>%
  mutate(Percent = n/909)

pitchers20percent <- pitchers20_labels %>%
  mutate(Percent = n/735)

hitters21percent <- hitters21_labels %>%
  mutate(Percent = n/1375)

hitters20percent <- hitters20_labels %>%
  mutate(Percent = n/621)

View(WAR20percent)

View(WAR21percent)

View(pitchers21percent)

##histogram with WAR bins and totals above each bin 2021
ggplot(WAR21, aes(x=WAR))+
  geom_histogram(fill='steelblue', col='black', binwidth=1, center=0.5)+
  stat_bin(aes (y=..count.., label=..count..), geom="text", binwidth=1, center=0.5, vjust=-.5) +
  labs(title = "2021 MLB fWAR Distribution, No PA/IP Minimums")+
  scale_x_continuous(breaks = seq(-1.5, 7.5, by = 1.0),
                     # updating bin labels (same length as breaks)
                     labels = c('-2 to -1', '-1 to 0', '0 to 1', '1 to 2', '2 to 3', '3 to 4', '4 to 5', '5 to 6', '6 to 7', '7 to 8'))+
  ylab ("")+
  xlab("fWAR")+
  # updating to removes y-axis counts and ticks
  theme(axis.text.y = element_blank()) +
  theme(axis.ticks.y = element_blank()) +
  theme(axis.title.y = element_text(color="#993333", size=13, face="bold"))+
  theme(axis.title.x = element_text(color="#993333", size=13, face="bold"))+
  theme(plot.title = element_text(color="Dark Red", size=14, face="bold.italic"))+
  theme(axis.text.x = element_text(color = "dark red", size = 9, face ="bold"))
