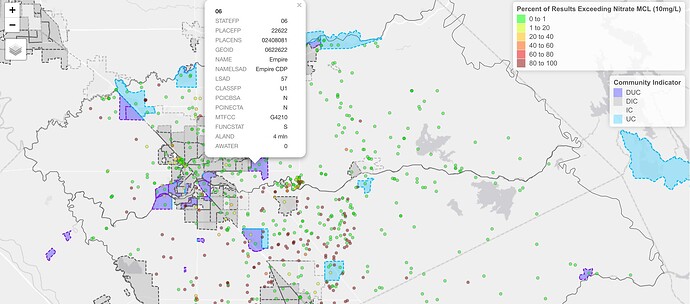
I am trying to plot wells in tmap so that I can show which wells have high nitrate contamination in the Californa Central Valley. I have been successful but this will be given to community members and I would like them to be able to see other columns in the data frame I am plotting such as mean nitrate level, well depth, county, community, etc. by clicking on a well of interest in the map view. Other shapes that I plot are showing the other columns in the dataset when I am plotting tm_polygons but for some reason I cannot find my tm_dots will not show the other colums when clicked on.
My code is insanely long due to the cleaning of my data so I will just give the section for tmap
## T-Map interactive Map
df_sum<- df_sum%>%filter(depth == "shallow")

tmap_mode("view")
  #tm_basemap("Stamen.TonerLite") +
  tm_shape(Basins)+ tm_borders()+
  tm_shape(CVSalts) + tm_polygons(col = "NitrateLev", palette = c("grey", "green","greenyellow", "yellow", "darkorange", "red"),
                                    auto.palette.mapping = FALSE,
                                    legend.hist = TRUE, alpha = 0.7,
                                    border.alpha = 0.3,
                                    title="CVSalts Interpolation (mg/L)")+
  tm_shape(DUC)+ tm_fill(col = "blue", alpha = 0.3)+ tm_borders(col = "blueviolet", lwd = 2, lty = "dashed")+
  tm_shape(DIC)+ tm_fill(col = "grey61", alpha = 0.3)+ tm_borders(col = "grey40",lwd = 2, lty = "dashed")+
  tm_shape(IC)+ tm_fill(col = "grey95", alpha = 0.3)+ tm_borders(col = "grey75", lwd = 2, lty = "dashed")+
  tm_shape(UC)+ tm_fill(col = "deepskyblue", alpha = 0.3)+ tm_borders(col = "deepskyblue", lwd = 2, lty = "dashed")+
  #tm_tiles("Stamen.TonerLabels")+
  tm_shape(df_sum)+ tm_dots(col = "perct_exceedance",
                            palette = c("green", "yellow",
                                        "darkorange", "red",  "red4"),
            alpha = 0.5, breaks = c(0, 1, 20, 40, 60, 80, 100),
            #labels("0% - <1%", "1% - <20%", "20% - <40%", "40% - <60%", "60% - <80%" ),
            title = "Percent of Results Exceeding Nitrate MCL (10mg/L)")+
  tm_shape(WaterSystems)+ tm_fill(col = "lightblue", alpha = 0.3)+ tm_borders(col = "lightblue", lwd = 2, lty = "dashed")+
  tm_shape(WaterSystem)+ tm_fill(col = "orange", alpha = 0.3)+
Here is the head of by df in question
> head(df_sum)
Simple feature collection with 6 features and 26 fields
geometry type:  POINT
dimension:      XY
bbox:           xmin: -120.84 ymin: 37.39981 xmax: -120.4234 ymax: 37.52253
CRS:            +proj=longlat +datum=WGS84 +no_defs
# A tibble: 6 x 27
  mean_result                  geometry max_result min_result
        <dbl>               <POINT [°]>      <dbl>      <dbl>
1       0.316           (-120.84 37.43)       1.1        0
2       3.75       (-120.7466 37.39981)       9.76       0.5
3       1.15       (-120.7464 37.40097)       4.72       0.4
4       4.18       (-120.4344 37.52253)       4.95       3.52
5       0.633      (-120.4234 37.52251)       0.84       0.47
6       0.312      (-120.7464 37.40097)       1.1        0
# … with 23 more variables: median_result <dbl>, above <int>,
#   below <int>, above_7.5 <int>, below_7.5 <int>, long <dbl>,
#   lat <dbl>, MCL <dbl>, well.ID <chr>, chem.ID <chr>,
#   chem <chr>, unit <chr>, well.depth.ft <dbl>,
#   data.source <chr>, well.type <chr>, top.of.screen.ft <dbl>,
#   bottom.of.screen.ft <dbl>, county <chr>, depth <chr>,
#   Basin <chr>, Community <chr>, perct_exceedance <dbl>,
#   perct_exceedance7.5 <dbl>
I wanted to include a screenshot of clicking on another element showing that it succesfully included all the columns in the df but since I am a new user I can only put one ![]() so just imagine a photo of a shape that is plotted with tm_fill and when clicked on shows the other columns in the df
so just imagine a photo of a shape that is plotted with tm_fill and when clicked on shows the other columns in the df
What I get when I plot with tm_dots - I only get the percent exceedance and some other unspecified column...
Please let me know what I am doing wrong I have scoured forums for someone with a similar problem and no one seems to encounter this problem...
