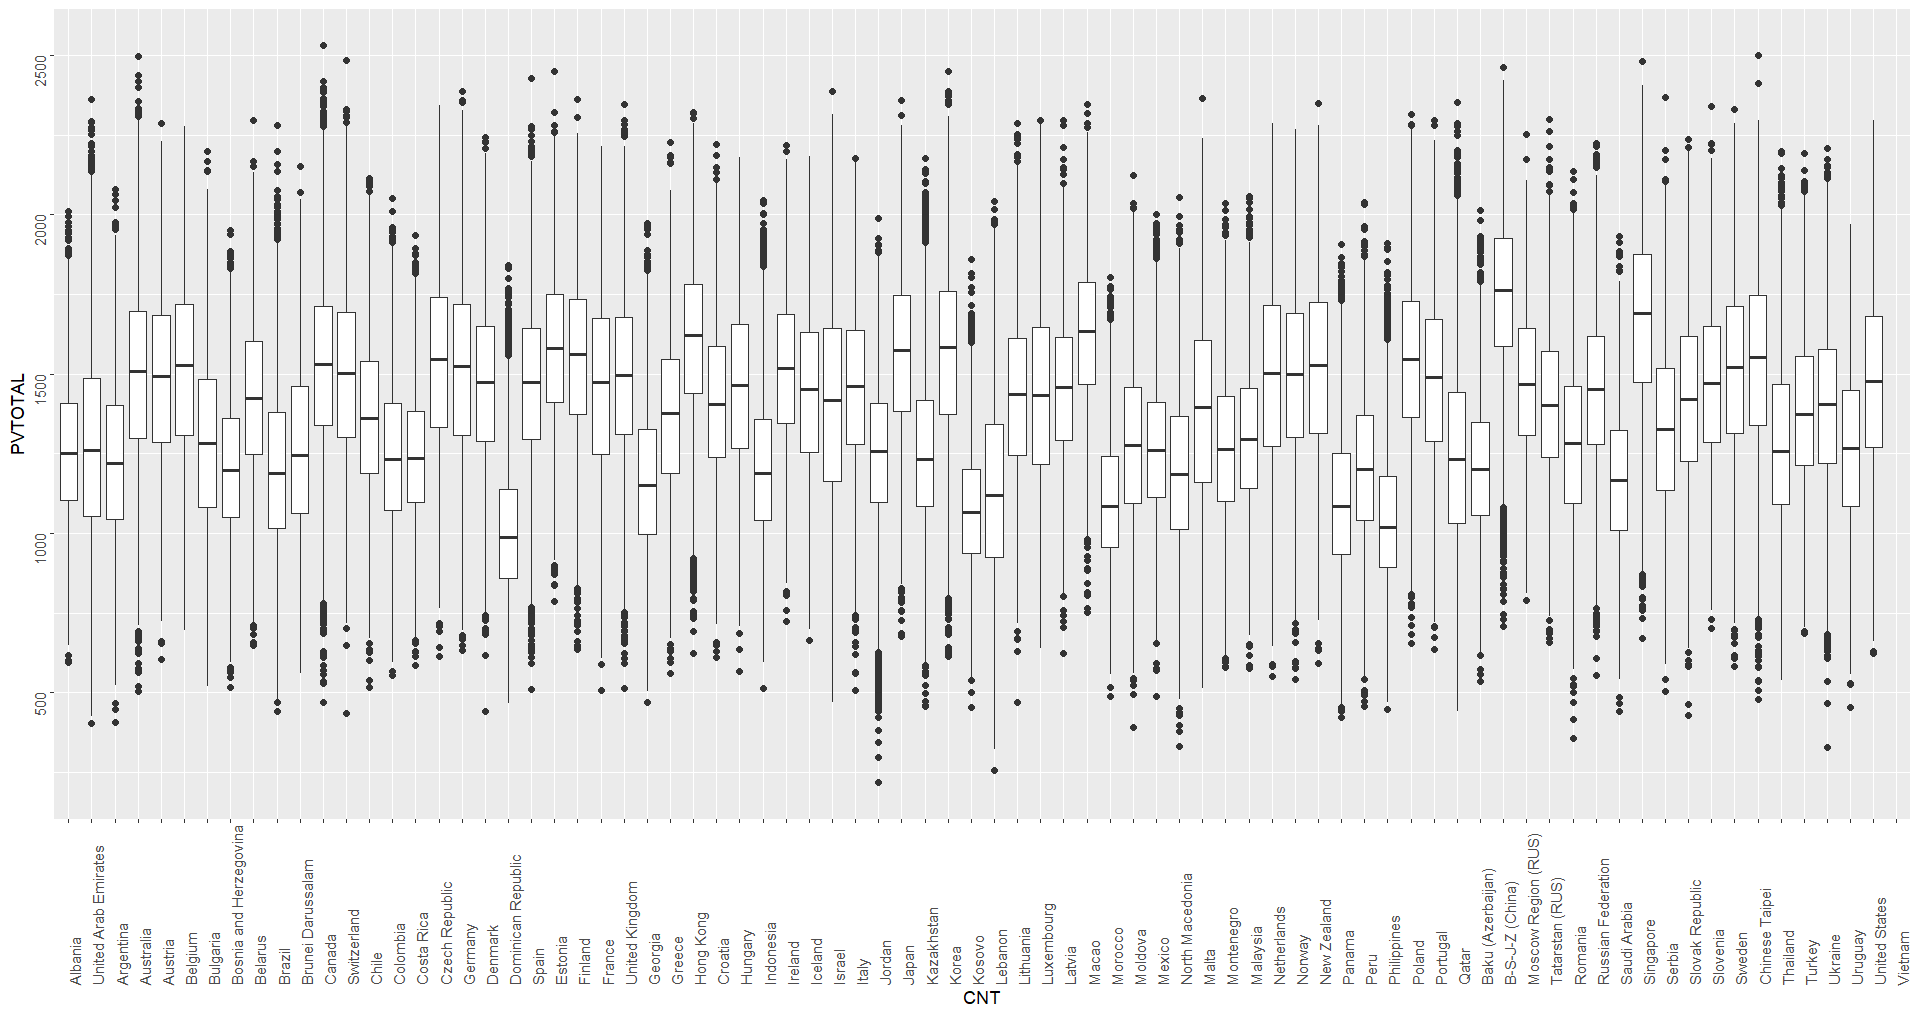
Hello, I have made this graph and I would like to add a line with the total mean and the total median to the graph that cross the whole graph.
DATA%>%
  ggplot(aes(x = CNT, y = PVTOTAL))+
  geom_boxplot()+
  easy_rotate_labels()
Hello, I have made this graph and I would like to add a line with the total mean and the total median to the graph that cross the whole graph.
DATA%>%
ggplot(aes(x = CNT, y = PVTOTAL))+
geom_boxplot()+
easy_rotate_labels()
Here is a simple example of what I think you want.
DF <- data.frame(Name = rep(c("A","B","C"), 30), Value = rnorm(90))
head(DF)
#>   Name      Value
#> 1    A  0.5969224
#> 2    B  1.1423760
#> 3    C  0.1074961
#> 4    A -1.5284152
#> 5    B -0.7479784
#> 6    C -0.3417590
DF_Stats <- data.frame(Stat = c("Mean","Median"),
                       Stat_Value = c(mean(DF$Value), median(DF$Value)))
DF_Stats
#>     Stat Stat_Value
#> 1   Mean -0.2168492
#> 2 Median -0.3358145
library(ggplot2)
ggplot(DF, aes(Name, Value)) + geom_boxplot() +
  geom_hline(data = DF_Stats,
             mapping = aes(yintercept = Stat_Value, color = Stat))
Created on 2023-05-19 with reprex v2.0.2
Hi @FJCC,
Is it possible to place labels with actual values for mean and median ? This is difficult to figure it out from plot what theirs values are.
Is it possible to add a mean for each group with yellow colour so we do have it apart from grand mean ?
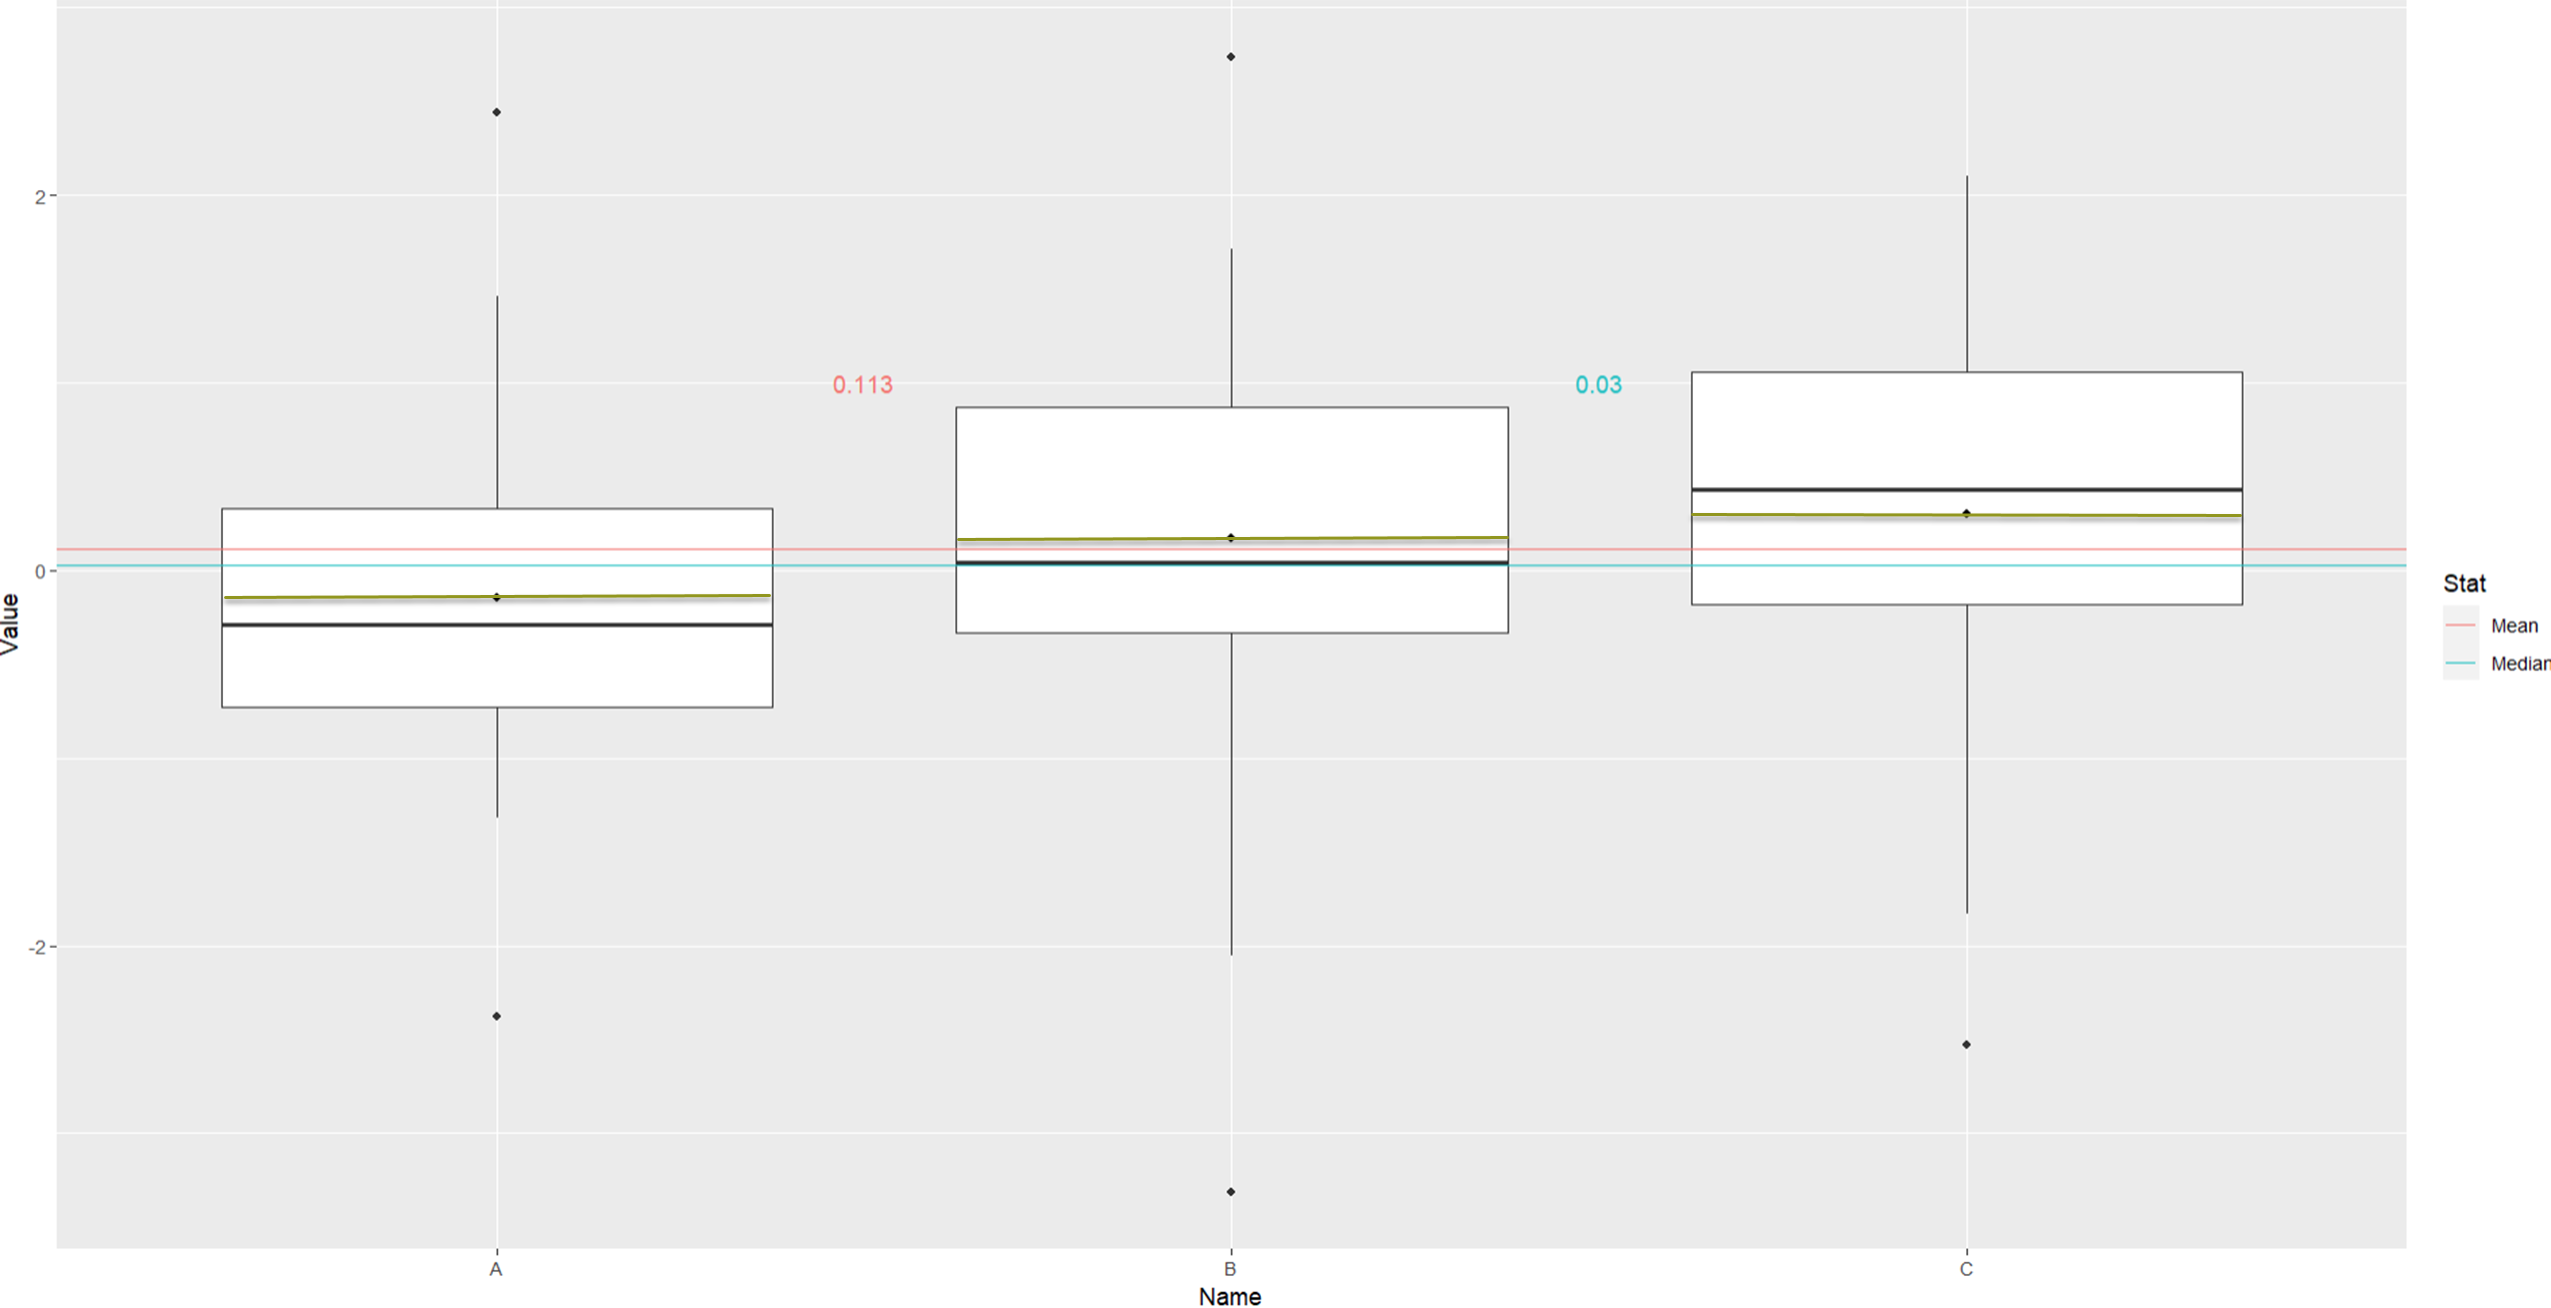
Here is one version of displaying the values of the global mean and median and adding a data point to each boxplot showing the mean.
DF <- data.frame(Name = rep(c("A","B","C"), 30), Value = rnorm(90))
head(DF)
#>   Name       Value
#> 1    A -1.05411137
#> 2    B -0.67697338
#> 3    C -0.80538918
#> 4    A  0.34424211
#> 5    B -0.05592012
#> 6    C -0.41565611
DF_Stats <- data.frame(Stat = c("Mean","Median"),
                       Stat_Value = c(mean(DF$Value), median(DF$Value)))
DF_Stats
#>     Stat Stat_Value
#> 1   Mean -0.1115978
#> 2 Median -0.1412545
library(ggplot2)
ggplot(DF, aes(Name, Value)) + geom_boxplot() +
  geom_hline(data = DF_Stats,
             mapping = aes(yintercept = Stat_Value, color = Stat)) +
  stat_summary(fun = mean, geom="point") +
  geom_text(aes(x = c(1.5, 2.5), y = 1, label = round(Stat_Value,3), color = Stat),
            data = DF_Stats, show.legend = FALSE)
Created on 2023-05-20 with reprex v2.0.2
Thank you, when I change from geom="point" to geom="line" in stat_summary, nothing is displayed.
Actually the following warning is displayed:
"geom_line(): Each group consists of only one observation.
Do you need to adjust the group aesthetic?"
Why is that ?
Because the x axis is categorical, ggplot assumes grouping by that variable. Since there is only one value in each group, a line cannot be drawn. This can be fixed by including group =1 in the aes().
ggplot(DF, aes(Name, Value)) + geom_boxplot() +
  geom_hline(data = DF_Stats,
             mapping = aes(yintercept = Stat_Value, color = Stat)) +
  stat_summary(fun = mean, geom="line", mapping = aes(group = 1)) +
  geom_text(aes(x = c(1.5, 2.5), y = 1, label = round(Stat_Value,3), color = Stat),
            data = DF_Stats, show.legend = FALSE)
How come the median which is inside a box (black line) can be a line, but a mean can't and it only works when mean is set to "point" ?
I do not get it that "Each group consists of only one observation" as there are 3 groups (A, B, C) in Name variable.
What am I missing ?
My desired result:
The mean can be a line, it is just more work. You can use geom_linerange. The first category on the x axis is at position 1, the second is at 2, and so on. I used this fact to add an X column to the Means data frame.
There may be a better way to do this and this is very manual.
library(ggplot2)
library(dplyr)
DF <- data.frame(Name = rep(c("A","B","C"), 30), Value = rnorm(90))
head(DF)
DF_Stats <- data.frame(Stat = c("Mean","Median"),
                       Stat_Value = c(mean(DF$Value), median(DF$Value)))
Means <- DF |> group_by(Name) |> summarize(Mean = mean(Value)) |>
  mutate(X = 1:3)

ggplot(DF, aes(Name, Value)) + geom_boxplot(width = 0.8) +
  geom_hline(data = DF_Stats,
             mapping = aes(yintercept = Stat_Value, color = Stat)) +
  geom_linerange(data = Means,
                 mapping = aes(x = Name, y = Mean, xmin = X - 0.4, xmax = X + 0.4),
                 color = "blue", size = 1) +
  geom_text(aes(x = c(1.5, 2.5), y = 1, label = round(Stat_Value,3), color = Stat),
            data = DF_Stats, show.legend = FALSE)
My comment "Each group consists of only one observation" refers to the data after stat_summary has calculated the mean. There is only one mean value at each x position.
Thank you that you patiently explained this to me. Much appreciated and I have learnt geom_linerange() as I did not know about it. Greatly appreciated.
This topic was automatically closed 7 days after the last reply. New replies are no longer allowed.
If you have a query related to it or one of the replies, start a new topic and refer back with a link.