Adding lines using lines() function with missing data

Hi,

I am trying to plot eleven lines showing contaminant concentration data for eleven sample sites over time (i.e, one line per site).

To do this, I started by plotting the concentrations from the first site using the code:

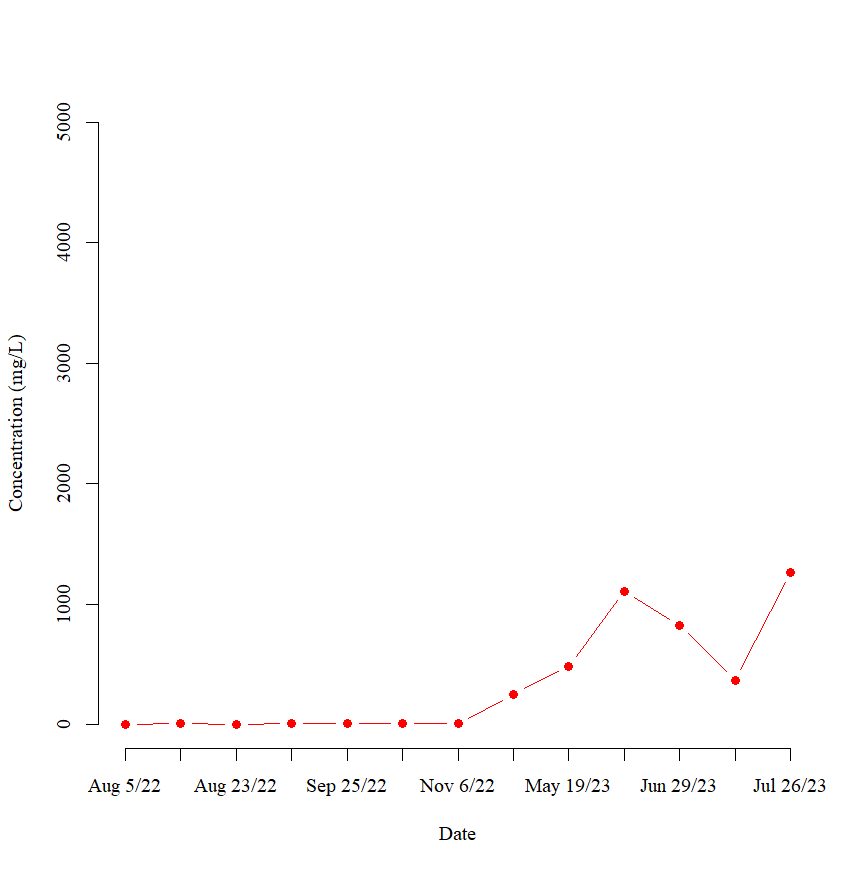
plot(TSSConc.dat$C1In1, type = "b", xlab = "Date", ylab = "Concentration (mg/L)", frame = FALSE, pch = 19, col = "red", xaxt = "n", family = "A", ylim = c(0,5000))

This code returns the following plot:

I then used the lines function to add my next sample site to using the code

lines(TSSConc.dat$C2In, type = "b", col = "cyan", lty = 1, lwd = 2, pch = 16)

This code returns the following plot:

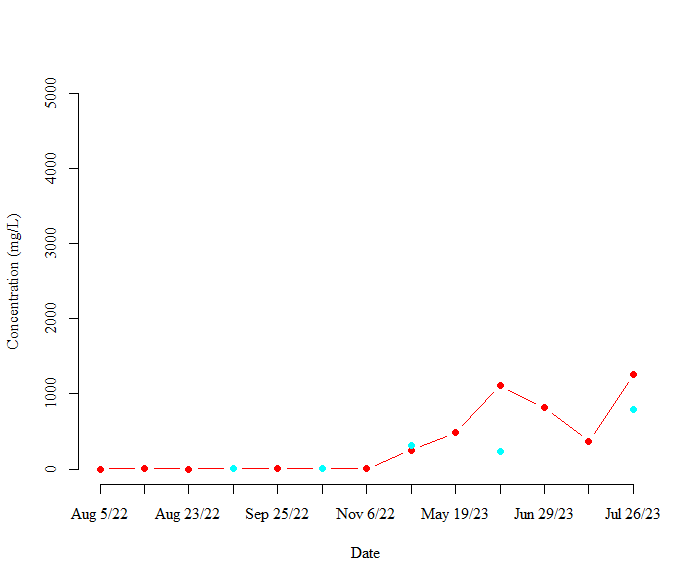
As shown in the above plot, the cyan points are not connected by any lines. I assume that this is because there are missing values for this sample site.

As I continue to add sites, the lines do not draw correctly for sites with missing values. Is there a way to get R to bypass the missing value and draw a line to the next value?

TIA

What happens if you do

It now returns the following plot, which it also incorrect. I want a line plot for C1In1, C1In2, C1Out, C2In, C2Out, C3In, and C3Out. Is there anything wrong maybe with how my data is formatted? I have included a sample of my data below.

Date C1In1 C1In2 C1Out C2In C2Out C3In C3Out
1 2022-08-05 0.000 NA NA NA NA NA NA
2 2022-08-18 8.794 8.794 8.898 NA NA 8.52 8.96
3 2022-02-23 0.000 NA NA NA NA 9.10 8.85
4 2022-09-09 9.380 NA 8.900 8.64 8.50 8.50 4.23
5 2022-09-25 8.860 8.660 7.980 NA NA 4.21 4.48
6 2022-10-12 4.866 NA 4.280 4.38 4.21 4.46 4.54
7 2022-11-06 5.124 NA 4.880 NA NA NA NA
8 2023-04-29 250.000 70.590 91.950 313.87 237.70 98.16 57.43
9 2023-05-19 484.630 NA 197.910 NA NA 4494.04 2487.91
10 2023-06-24 1107.530 NA 196.260 233.01 162.16 NA NA
11 2023-06-29 821.920 NA 367.920 NA NA NA NA
12 2023-07-09 367.500 NA 317.300 NA NA NA NA
13 2023-07-26 1265.600 NA 433.300 788.60 117.20 606.60 447.60

Ah, you need to also select the relevant points on the x-axis. Something like

lines(TSSConc.dat$Date[!is.na(TSSConc.dat$C2In)],
TSSConc.dat$C2In[!is.na(TSSConc.dat$C2In)], type = "b", col = "cyan", lty = 1, lwd = 2, pch = 16)

When I add the following lines that you suggested (see below), I receive the warning message: "In xy.coords(x,y): NAs introduced by coercion", and the lines do not appear on the graph. I have included my revised code below.

lines(TSSConc.dat$Date[!is.na(TSSConc.dat$C2In)], 
      TSSConc.dat$C2In[!is.na(TSSConc.dat$C2In)], type = "b", col = "cyan", lty = 1, lwd = 2, pch = 16)

You have a time series. I was thinking that Date gave the date, but I think the date is actually built into the time series object. That's probably why my suggestion didn't work.

Maybe someone else can give more useful help?

Thanks, for trying, I really appreciate it. I'm looking around at other forums now.

If you would like support; best practice is to provide a reprex. something like the output of dput() would provide the necessary detail as this would provide type and class info that may be relevant.

Thank you. Here is a reprex of my data from the dput() output.

dput(TSSConc.dat)
structure(list(Date = c("2022-08-05", "2022-08-18", "2022-02-23",
"2022-09-09", "2022-09-25", "2022-10-12", "2022-11-06", "2023-04-29",
"2023-05-19", "2023-06-24", "2023-06-29", "2023-07-09", "2023-07-26"
), C1In1 = c(0, 8.794, 0, 9.38, 8.86, 4.866, 5.124, 250, 484.63,
1107.53, 821.92, 367.5, 1265.6), C1In2 = c(NA, 8.794, NA, NA,
8.66, NA, NA, 70.59, NA, NA, NA, NA, NA), C1Out = c(NA, 8.898,
NA, 8.9, 7.98, 4.28, 4.88, 91.95, 197.91, 196.26, 367.92, 317.3,
433.3), C2In = c(NA, NA, NA, 8.64, NA, 4.38, NA, 313.87, NA,
233.01, NA, NA, 788.6), C2Out = c(NA, NA, NA, 8.5, NA, 4.21,
NA, 237.7, NA, 162.16, NA, NA, 117.2), C3In = c(NA, 8.52, 9.1,
8.5, 4.21, 4.46, NA, 98.16, 4494.04, NA, NA, NA, 606.6), C3Out = c(NA,
8.96, 8.85, 4.23, 4.48, 4.54, NA, 57.43, 2487.91, NA, NA, NA,
447.6)), class = "data.frame", row.names = c(NA, -13L))

As shown in the reprex, C1In2, C1Out, C2In, C2Out, C3In and C3 Out all have a significant amount of missing data (NA). I think that this is part of why the time series aren't plotting correctly.

There are different possible approaches.
Here is one, which I think is closest to what startz had suggested.

TSSConc.dat <- structure(list(Date = c(
  "2022-08-05", "2022-08-18", "2022-02-23",
  "2022-09-09", "2022-09-25", "2022-10-12", "2022-11-06", "2023-04-29",
  "2023-05-19", "2023-06-24", "2023-06-29", "2023-07-09", "2023-07-26"
), C1In1 = c(
  0, 8.794, 0, 9.38, 8.86, 4.866, 5.124, 250, 484.63,
  1107.53, 821.92, 367.5, 1265.6
), C1In2 = c(
  NA, 8.794, NA, NA,
  8.66, NA, NA, 70.59, NA, NA, NA, NA, NA
), C1Out = c(
  NA, 8.898,
  NA, 8.9, 7.98, 4.28, 4.88, 91.95, 197.91, 196.26, 367.92, 317.3,
  433.3
), C2In = c(
  NA, NA, NA, 8.64, NA, 4.38, NA, 313.87, NA,
  233.01, NA, NA, 788.6
), C2Out = c(
  NA, NA, NA, 8.5, NA, 4.21,
  NA, 237.7, NA, 162.16, NA, NA, 117.2
), C3In = c(
  NA, 8.52, 9.1,
  8.5, 4.21, 4.46, NA, 98.16, 4494.04, NA, NA, NA, 606.6
), C3Out = c(
  NA,
  8.96, 8.85, 4.23, 4.48, 4.54, NA, 57.43, 2487.91, NA, NA, NA,
  447.6
)), class = "data.frame", row.names = c(NA, -13L))

TSSConc.dat$dt <- as.Date(TSSConc.dat$Date)
sorted_data <- TSSConc.dat[order(TSSConc.dat$dt), ]


plot(
  x = sorted_data$dt,
  y = sorted_data$C1In1,
  type = "b", xlab = "Date",
  ylab = "Concentration (mg/L)",
  frame = FALSE,
  pch = 19,
  col = "red",
  family = "A",
  ylim = c(0, 5000),
  xaxt = "n"
)

(fewdates <- seq.Date(from = min(sorted_data$dt),
                      to = max(sorted_data$dt),
                      length.out = 4))

axis(
  1,
  fewdates,
  format(fewdates, "%Y-%m-%d")
)

lines(
  x = sorted_data$dt[!is.na(sorted_data$C2In)],
  y = sorted_data$C2In[!is.na(sorted_data$C2In)],
  type = "b",
  col = "cyan",
  lty = 1,
  lwd = 2,
  pch = 16
)

2 Likes

Thank you. That seems to work.

This topic was automatically closed 42 days after the last reply. New replies are no longer allowed.

If you have a query related to it or one of the replies, start a new topic and refer back with a link.