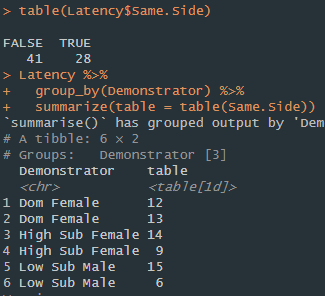
I'm trying the get the counts of both TRUE and FALSE in a column, grouped by another column.
I was able to figure out how to do that mostly, but the problem is I can't tell which count is TRUE and which count is FALSE. I know it's giving me the counts of the TRUE and FALSE because there's two rows for each group and they add up to the total number of TRUEs and FALSEs.
I found the roundabout way of which one is TRUE and which one is FALSE by adding up the numbers of the first value given for each group and seeing which count of TRUE/FALSE (when you use the table() by itself) it corresponds to. I want to add a label though so I can easily graph it.
what do I need to add to this code to identify which is TRUE and which is FALSE?
since you didn't provide the data i made up a reproducible sample. This would be my approach.
# Necessary libraries
library(magrittr)
library(dplyr)

# To make the execution reproducible
set.seed(1)

# Create DF since non provided
choices <- c("Dom Female", "High Sub Female", "Low Sub Female")
Latency <- data.frame(
  Demonstrator = sample(x = choices, size = 20, replace = TRUE),
  Same.Side = sample(
    x = c(T, F),
    size = 20,
    replace = TRUE
  )
)

# Proposed solution
Latency %>%
  group_by(Demonstrator, Same.Side) %>%
  summarize(table = n())
Output
`summarise()` has grouped output by 'Demonstrator'. You can override using the `.groups` argument.
# A tibble: 6 × 3
# Groups:   Demonstrator [3]
  Demonstrator    Same.Side table
  <chr>           <lgl>     <int>
1 Dom Female      FALSE         2
2 Dom Female      TRUE          5
3 High Sub Female FALSE         3
4 High Sub Female TRUE          4
5 Low Sub Female  FALSE         4
6 Low Sub Female  TRUE          2