I'm doing a table and need to add an image to the header, but the result is not as expected. Reproducible example:
library(gt)
dplyr::tibble(
        x = 1:5, ouch = 6:10
) %>%
        gt() %>%
        cols_label(
                x = img_header(
                        "",
                        "https://upload.wikimedia.org/wikipedia/commons/thumb/b/b1/Yellow_card.svg/200px-Yellow_card.svg.png",
                        height = 80
                )
        )
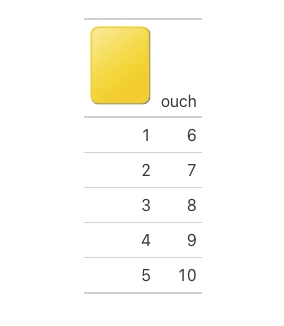
Output:

How can I rid the black line below the yellow card? (Is not in the original image)