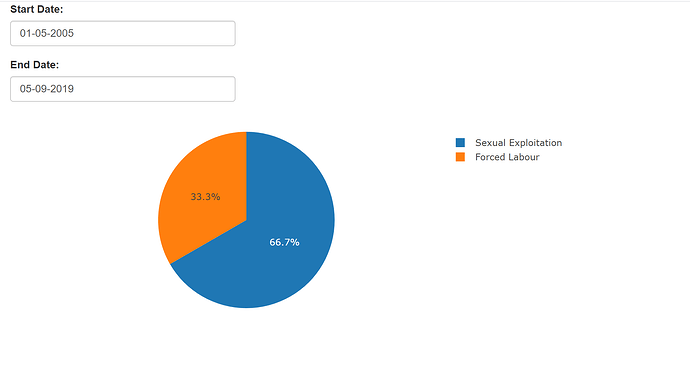
I previously asked this question before here : How to add dates as an input into a reactive graph but have since changed my filtering method and now the dates cause an error for the graphs. How do I go about getting all the graphs to change based on the dates selected.
UI:
dateInput("startdate", "Start Date:", value = "2019-08-01", format = "dd-mm-yyyy",
                min = "2000-01-01", max = "2019-09-04"),

      dateInput("enddate", "End Date:", value = "2019-09-05", format = "dd-mm-yyyy",
                min = "2000-01-02", max = "2019-09-05")
Server:
server <- function(input, output, session) {
filteredData <- reactive({
    filtNgo <- newngo
if(!is.null(input$victimGender)) {
      filtNgo <- filtNgo %>% filter(Victim.Gender %in% input$victimGender)
    }
    if(!is.null(input$traffickingType)) {
      filtNgo <- filtNgo %>% filter(Trafficking.Type %in% input$traffickingType)
    }
    if(!is.null(input$traffickingSubType)) {
      filtNgo <- filtNgo %>% filter(Trafficking.Sub.Type %in% input$traffickingSubType)
    }
    if(!is.null(input$Source)) {
      filtNgo <- filtNgo %>% filter(Data.Source %in% input$Source)
    }
filtNgo
  })

output$traff <- renderPlotly({
    plot_ly(filteredData(), labels = ~Trafficking.Type, type = "pie",
            marker = list(colors = colors,
                          line = list(color = '#FFFFFF', width = 1))) %>%
      layout(showlegend = FALSE)
  })

  output$Sub <- renderPlotly({
    ggplot(filteredData(), aes(x=Trafficking.Sub.Type)) + geom_bar()
  })

  output$vGender <- renderPlotly({
    ggplot(filteredData(), aes(x=Victim.Gender)) + geom_bar()
  })
I have attached a few of the graphs ensure that more than one graph will work.
