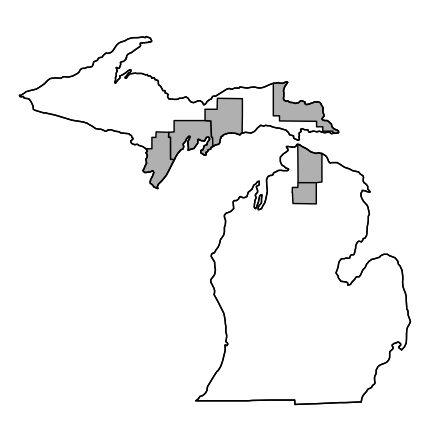
I am trying to create a map of Michigan with some particular counties highlighted. Which I have done so here:
The code I'm working with is: #create Michigan map
mi_base <- ggplot(data = mi_df, mapping = aes(x = long, y = lat, group = group)) +
coord_fixed(1.3) +
geom_polygon(color = "black", fill="white")+
theme_void()
mi_base
mi_base+ geom_polygon(data = mi_study_counties, fill = "gray", color = "black") +
geom_polygon(color = "black", fill = NA)
What I need help with is labeling the county names on the counties that I have highlighted. Also, is there a way to do a fill of different colors for the different counties? Like fill 3 of them gray and 3 of them blue? Any help is greatly appreciated!
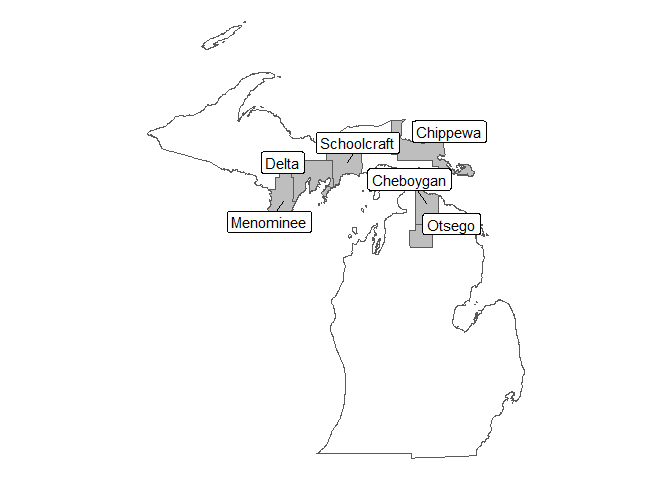
If you're interested in dipping your toe into a new spatial paradigm in R, I would highly recommend looking into the sf package. It integrates very well with plotting in ggplot, leaftlet, mapview, and other spatial packages in R.
Below is a worked example of getting state and county sf data from the tigris package and then using ggplot2 to make and label the map. FYI: I used the ggsflabel package for the labels and it is only on github for now. If you need CRAN packages only, you can simply replace geom_sf_label_repel() with geom_sf_label() which is part of ggplot2.
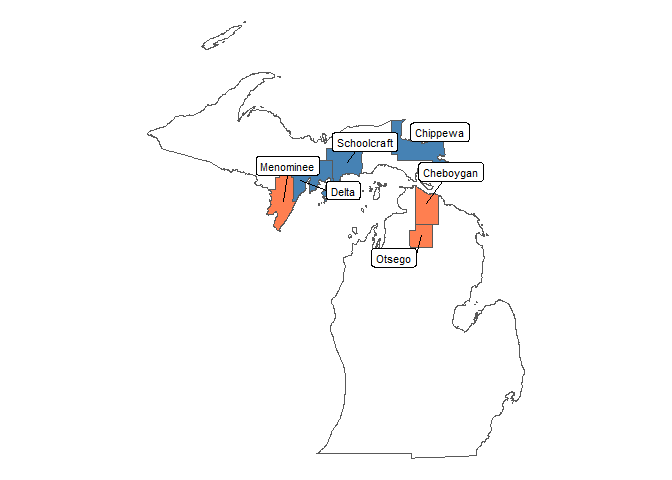
This is perfect! Thank you. Any idea on putting colors for specific counties? I need Delta, Schoolcraft, and Chippewa Counties to be one color, and Menominee, Cheboygan, and Otsego Counties to be another color.
Sure thing! One easy way is to define the colors in the data frame you send into ggplot() and the use scale_fill_identity() to use those colors for fill.