Hello!
this is my data file
> str(phylum)
tibble [32 × 15] (S3: tbl_df/tbl/data.frame)
 $ sample           : chr [1:32] "s121" "s122" "s123" "s124" ...
 $ Treatment        : Factor w/ 4 levels "Control","Drought",..: 2 2 2 2 2 2 2 2 3 3 ...
 $ Variety          : Factor w/ 2 levels "Extase","Sahara": 2 1 1 2 2 1 2 1 1 1 ...
 $ Planctomycetota  : num [1:32] 0.372 0.386 0.36 0.379 0.351 ...
 $ Acidobacteriota  : num [1:32] 0.23 0.228 0.22 0.23 0.251 ...
 $ Actinobacteriota : num [1:32] 0.096 0.0942 0.097 0.0963 0.0917 ...
 $ Verrucomicrobiota: num [1:32] 0.064 0.0623 0.0715 0.0671 0.0611 ...
 $ Chloroflexi      : num [1:32] 0.123 0.118 0.127 0.118 0.127 ...
 $ Methylomirabilota: num [1:32] 0.00758 0.00697 0.00677 0.0086 0.00738 ...
 $ Proteobacteria   : num [1:32] 0.0573 0.0555 0.0685 0.0553 0.0632 ...
 $ Gemmatimonadota  : num [1:32] 0.016 0.0142 0.0187 0.0144 0.0165 ...
 $ Myxococcota      : num [1:32] 0.00528 0.00515 0.00433 0.00433 0.00494 ...
 $ Patescibacteria  : num [1:32] 0.000677 0.000813 0.000339 0.000474 0.000745 ...
 $ Firmicutes       : num [1:32] 0.00528 0.00704 0.00427 0.00562 0.00399 ...
 $ Others           : num [1:32] 0.0228 0.0221 0.0217 0.0215 0.0209 ...
I made this boxplots:
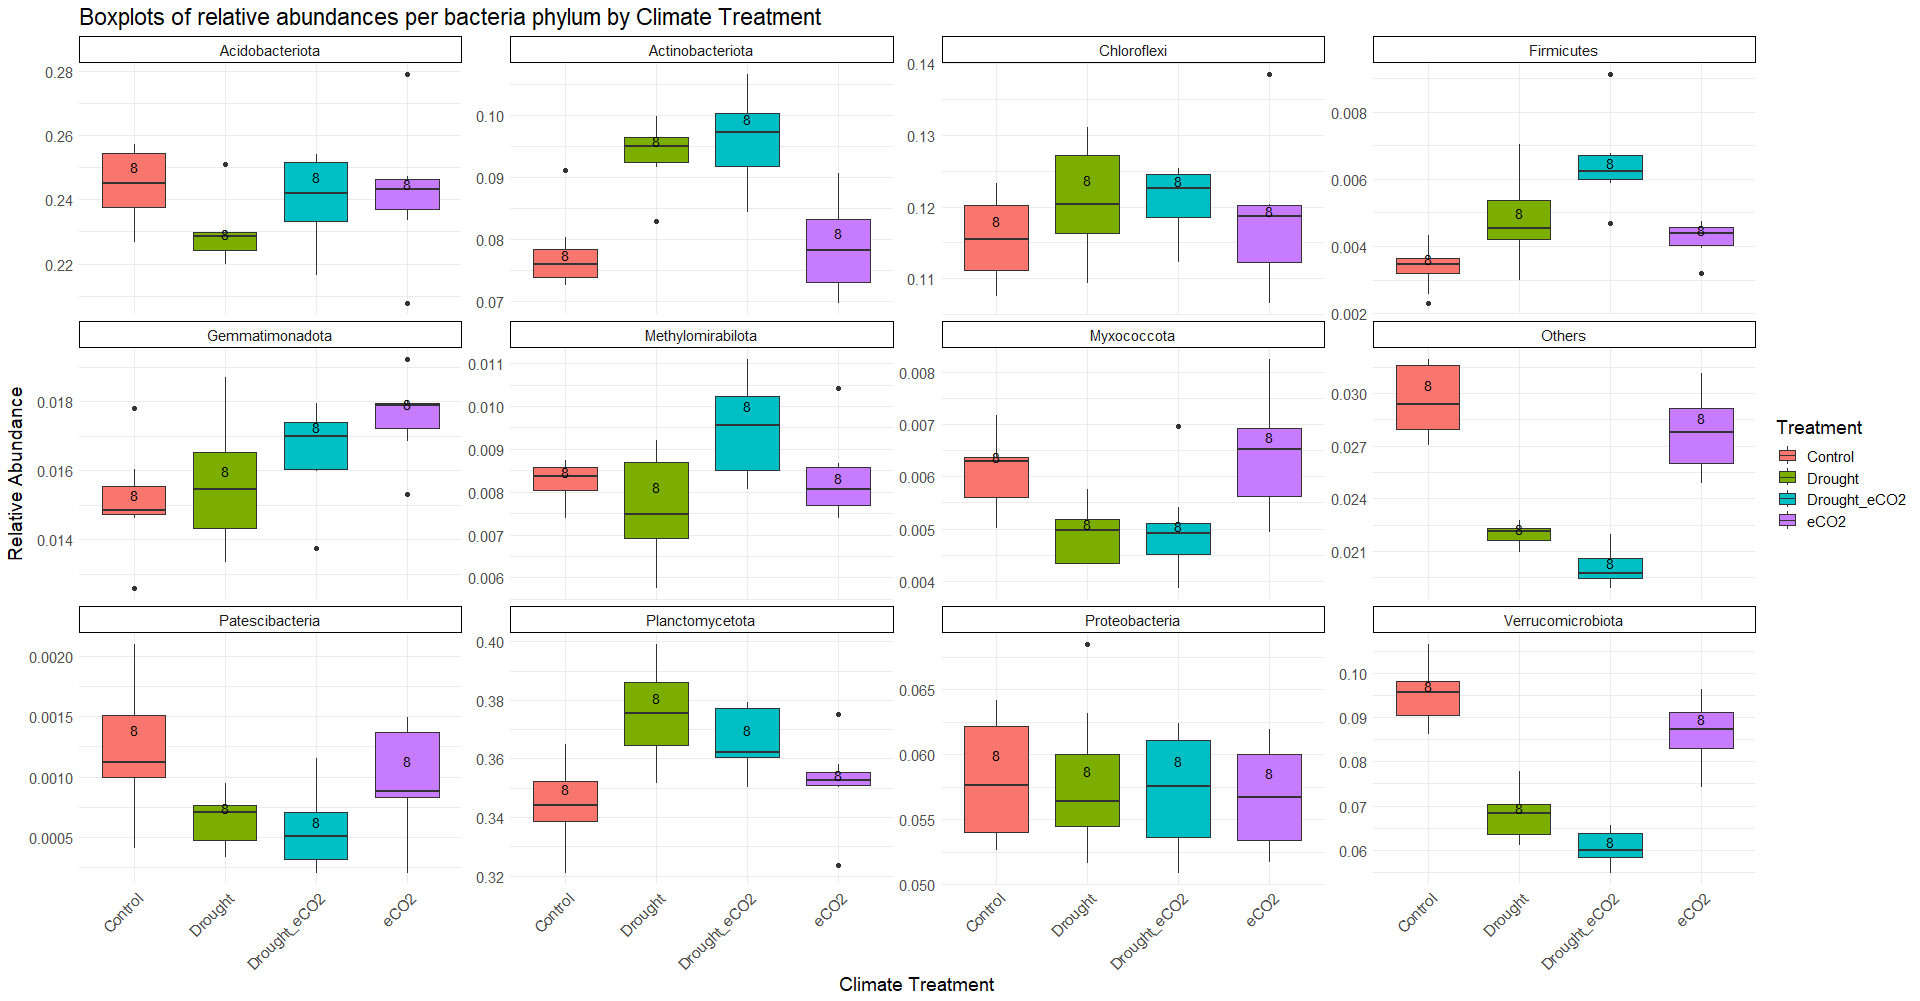
Now I want to add the comparaison letters, not so easy for me. Can someone help me?
This is my actual code:
phylum_long <- pivot_longer(phylum, cols = -c(sample, Treatment, Variety), names_to = "Phylum", values_to = "Relative_Abundance")

ggplot(phylum_long, aes(x = Treatment, y = Relative_Abundance, fill = Treatment)) +
  geom_boxplot(position = position_dodge(0.8), width = 0.7) +
  stat_summary(fun.data = give.n, geom = "text", show.legend = FALSE) +
  labs(title = "Boxplots of relative abundances per bacteria phylum by Climate Treatment",
       x = "Climate Treatment",
       y = "Relative Abundance") +
  facet_wrap(~Phylum, scales = "free_y", ncol = 4) +
  theme_minimal()+
  theme(axis.text.x = element_text(angle = 45, hjust = 1)) +
  theme(strip.background = element_rect(colour = "black", fill = "white"), text = element_text(size = 15))

anova_results <- list()

for (y_var in y_var_names) {
  model <- lm(get(y_var) ~ Treatment, data = phylum)
  result <- Anova(model, type = "III")
  anova_results[[y_var]] <- result
}
print(anova_results)
###Big significant effects, but wich one differs?
anova_tukey_results <- list()

for (y_var in y_var_names) {
  anova_model <- aov(get(y_var) ~ Treatment, data = phylum)
  anova_result <- summary(anova_model)
  tukey_result <- TukeyHSD(anova_model)
  anova_tukey_results[[y_var]] <- list(ANOVA = anova_result, TukeyHSD = tukey_result)
}
print(anova_tukey_results)

library(multcompView)

comparison_letters_list <- list()

for (y_var in y_var_names) {
  tukey_result <- anova_tukey_results[[y_var]]$TukeyHSD

  letters <- multcompLetters(tukey_result$Treatment[, "p adj"])

  comparison_letters_list[[y_var]] <- letters
}

for (y_var in y_var_names) {
  print(paste("Comparison letters for", y_var))
  print(comparison_letters_list[[y_var]])
}
Can someone help me to put the comparaison letters like on the boxplots?