Is there some incantation I can use to have plotly::subplot draw (shared) x and y axes (without ticks, perhaps) on all subplots just so the individual subplots can be visually boxed in?
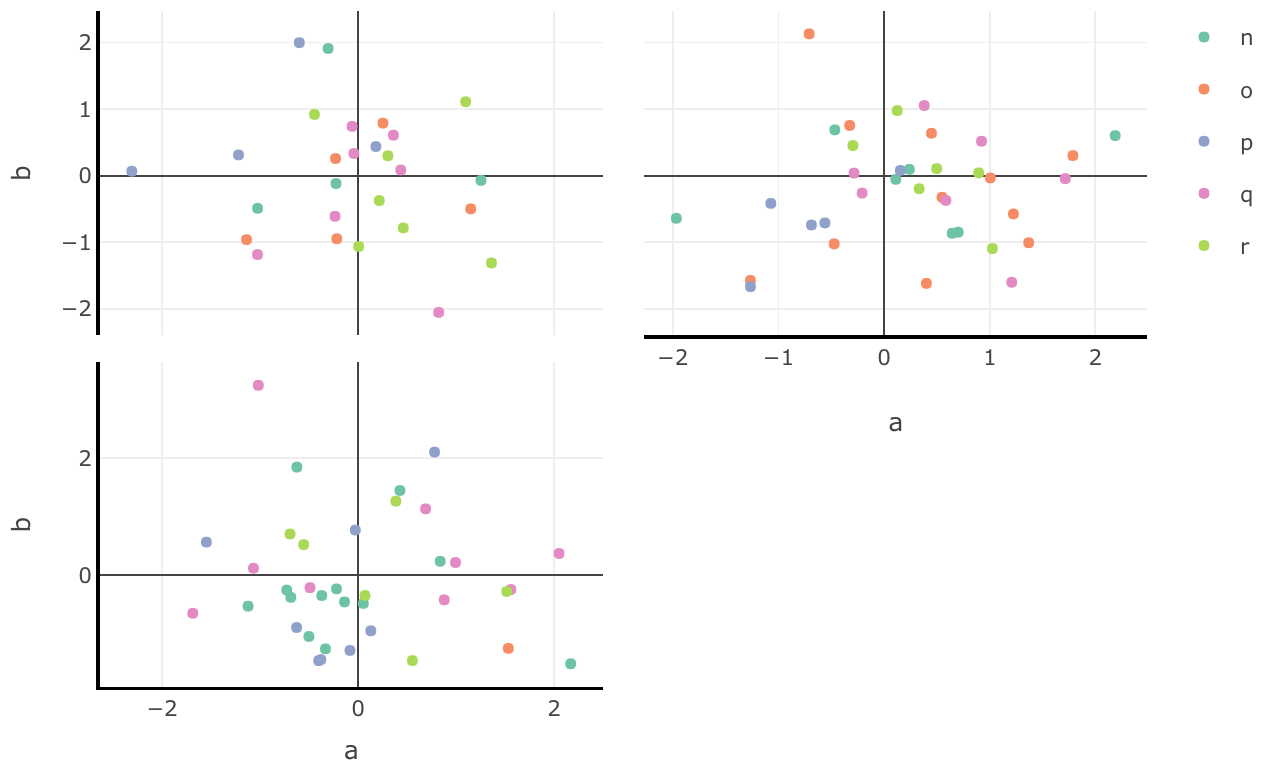
For example, I like everything about the following plot, except that:
- The top left subplot doesn't have a solid line/x-axis to frame its bottom; and
- The top right panel doesn't have a vertical line/border drawn on its y-axis to frame it:
library(dplyr)
library(plotly)
set.seed(123)

dat <- data.frame(
  a = rnorm(100), b = rnorm(100), c = rnorm(100),
  class = sample(c("g1", "g2", "g3"), 100, replace = TRUE),
  grp = sample(c("n", "o", "p", "q", "r"), 100, replace = TRUE))

axopts <- list(linecolor = toRGB("black"), linewidth = 2, showline = TRUE)

plots <- dat %>%
  group_by(class) %>%
  do(plot = {
    plot_ly(., x = ~a, y = ~b, legendgroup = ~grp,
            showlegend = .$class[1] == "g1") %>%
      add_markers(color = ~grp) %>%
      layout(xaxis = axopts, yaxis = axopts)
  })
subplot(plots, nrows = 2, shareX = TRUE, shareY = TRUE)
It would be great if we could just tweak the plot a bit to look more like this:
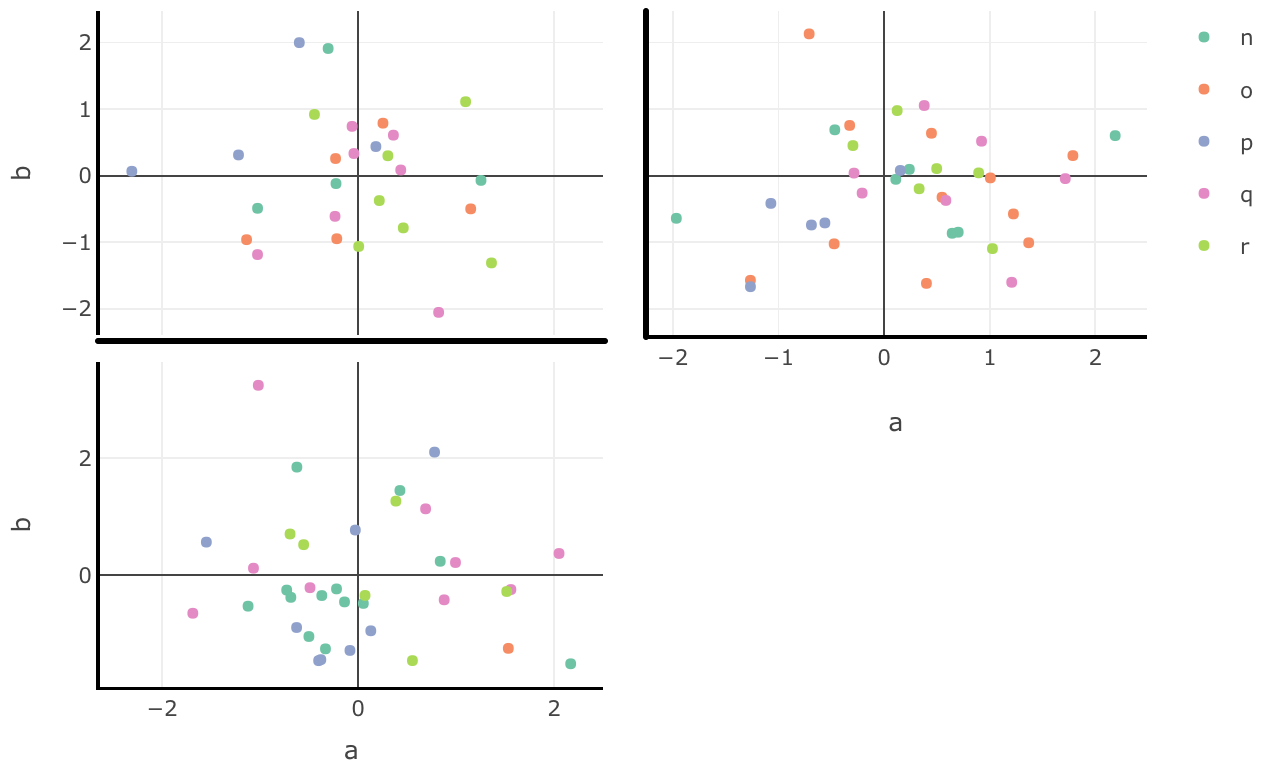
I know that calling subplot(..., shareX = FALSE, shareY = FALSE) gets us somewhere close to that, but I kind of like a few of the bells and whistles we get when setting the share* parameters to TRUE.
Thanks in advance!