Hi
I'm trying to add a shadow to a ggplot figure using the function geom_ribbon
this the code that I used
fa <- ggplot(a.d) +
geom_line(aes(x = Day, y = Average, group = TREATMENT, color = TREATMENT)) +
scale_x_discrete(limits = c("1", "2","3","4", "5","6", "7")) +
theme_light() +
geom_point(aes(y= Average, x=Day, shape = TREATMENT), color="navy", size=2) + scale_linetype_manual(values=c("twodash", "dotted"))+
scale_color_manual(values=c("black", '#999999','#E69F00')) +
scale_shape_manual(values = c( 18, 15, 19))
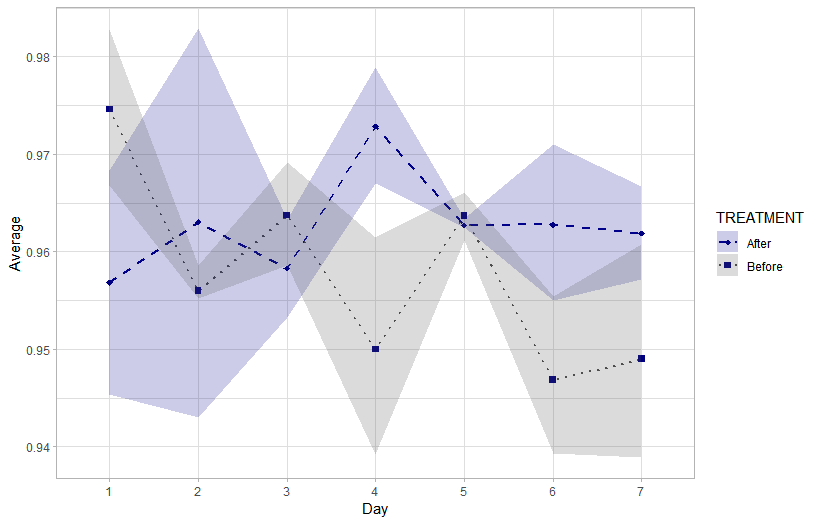
fa + geom_ribbon(aes(x= Day, ymax= Higher, ymin =Lower), alpha= 0.2, color="gray")
the data used is
Day <- c("1", "2","3","4", "5","6", "7")
TREATMENT <- c("Before", "After", "Before", "After", "Before", "After", "Before", "After", "Before", "After", "Before", "After", "Before", "After")
Average <- c("0.974598513", "0.963051443", "0.963739429", "0.972850821", "0.963693223", "0.962771596", "0.949008701", "0.956837133", "0.955958205", "0.958306944", "0.94998772", "0.962696996", "0.946854299", "0.96188742")
Higher <- c("0.966773519", "0.943048622", "0.958617511", "0.967044211", "0.961122713", "0.955043195", "0.938912595", "0.945416523", "0.955259169", "0.953216356", "0.939240136", "0.962453101", "0.939337425", "0.957117675")
Lower <- c( "0.982778141","0.982885844", "0.969171369", "0.978873615", "0.966079711", "0.971005989", "0.960760536", "0.968358478", "0.958638127", "0.963281061", "0.961505189", "0.963393992", "0.955463657", "0.966753163")
a.d <- data.frame(Day, TREATMENT, Average, Higher, Lower)
a.d
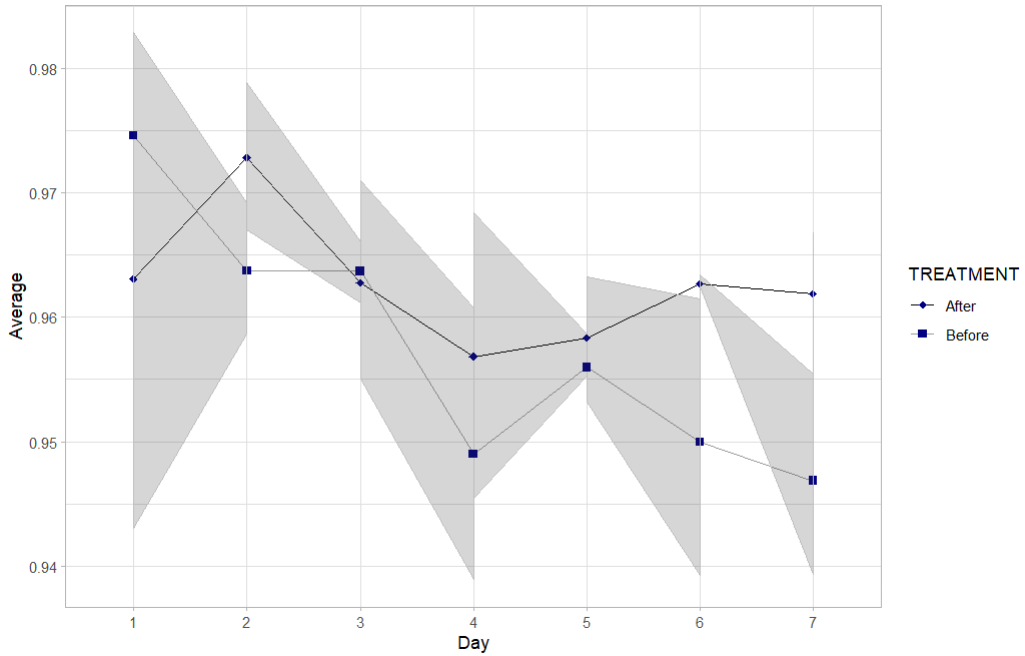
my question is, how to produce the figure with shadow for each line?
thank you in advance