Hi!
I have this input file with just one column: the gender of the participants
https://www.mediafire.com/file/txtbh2hfb8w2l20/demo.xlsx/file
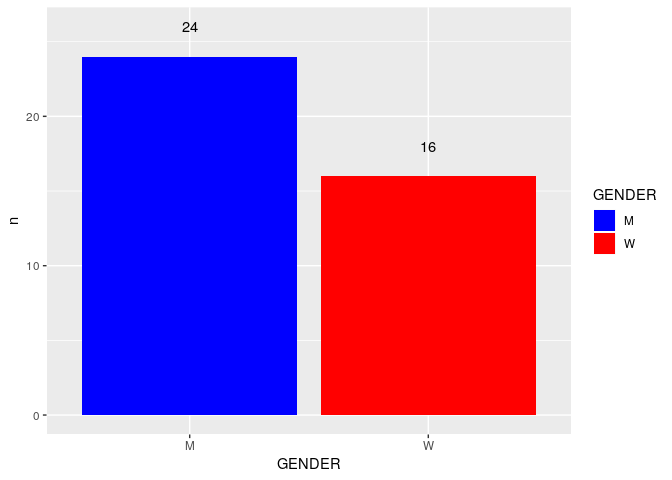
I'm plotting women in one bar and men in the other and works fine
demog <- read_xlsx("C:/Users/demo.xlsx")
library(ggplot2)
p<-ggplot(demog) + geom_bar(aes(x = demog$GENDER,fill=demog$GENDER), stat = "count")+scale_fill_manual(values=c("blue", "red"))
 p
Now I'm trying to add labels with the values at the top of each bar:
I need to add the 25 value at the top of the men bar and 15 at the top of the women bar
I tried geom_text but can't find the way how to put it in my code
geom_text(aes(label = y), position = "dodge")