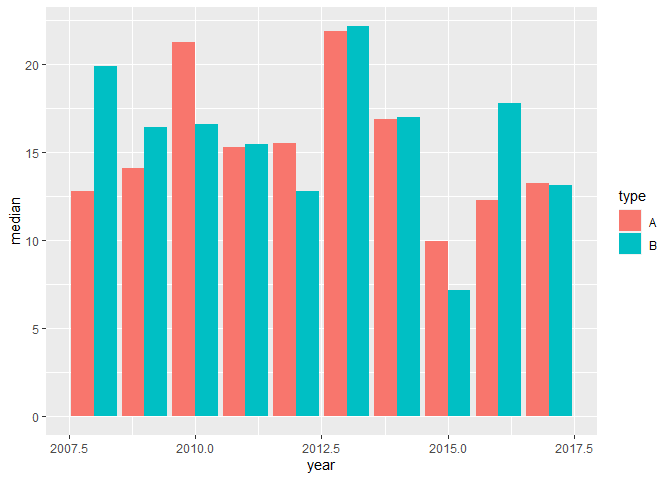
In the following plot, how do I add the corresponding values i.e. the medians on top of each bar?
suppressWarnings(suppressMessages(library(tidyverse)))

# Data
set.seed(123)
df <- tibble(
  year = rep(2008:2017, times = 2),
  type = rep(c("A", "B"), each = 10),
  median = rnorm(20, mean = 15, sd =4)
)

# Plot
df %>%
  ggplot(aes(x = year, y = median, fill = type)) +
  geom_col(position = "dodge")
Created on 2020-11-03 by the reprex package (v0.3.0)
FJCC
2
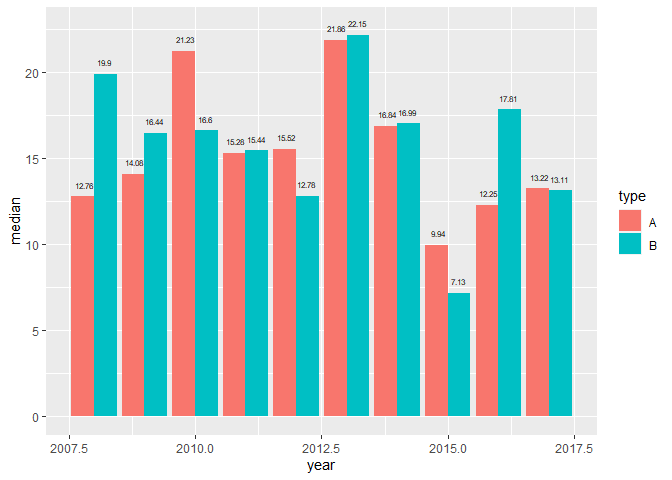
Here is one approach. Everything is no quite lined up but I think it gives the general idea.
set.seed(123)
df <- tibble::tibble(
  year = rep(2008:2017, times = 2),
  type = rep(c("A", "B"), each = 10),
  median = rnorm(20, mean = 15, sd =4)
)
library(ggplot2)
# Plot

  ggplot(df, aes(x = year, y = median, fill = type)) +
  geom_col(position = "dodge") +
  geom_text(aes(y = median + 0.5, label = round(median,2)),
            position = position_dodge(width = 0.8),
            size =2, vjust = 0, hjust = 0.5)
Created on 2020-11-03 by the reprex package (v0.3.0)
1 Like
Many thanks for the help!
system
Closed
4
This topic was automatically closed 7 days after the last reply. New replies are no longer allowed.
If you have a query related to it or one of the replies, start a new topic and refer back with a link.